Experimental Research Methods
2017-2019
Teaching Archive from MA Information Experience Design, Royal College of Art
Dylan Yamada-Rice
Here my teaching formed a series of three-hour workshops open to all MA IED students in Years 1 and 2. They were designed to support student’s collection of the “Information” part of their experience design work, and took a format of an introduction to an area of research theory followed by a practical workshops for students to explore this using hands-on techniques that they were free to experiment with and push further.
Knowing Through Making, Performance & Drawing
This workshop looked into how artistic practices of making, drawing and performance can be used as part of the research process to understand data. A short overview was provided of performance ethnography theory by introducing students to the the work of Solomon Lennox who has used the methodology as a means of analysing an ethnographic study on boxing. Knowing through making was explored in relation to the work of Katy Carroll and her fandom of Marcel Duchamp. I also shared examples from my own research where drawing has played a part in transcribing data, relating data to theory and dissemination of findings.
Performance Ethnography
In order to think about the definition of performance ethnography we started by exploring the meaning of ethnography as an approach to research; tracing it from the Chicago School. Then, drawing on my own research into children’s use of digital toys/games I showed how an ethnographic study can be used to inform design.
Students were asked to think about whether conducting research using observations is enough, and how else they could immerse themselves in the data to get to know the audience being designing for. Following this, students were introduced to performance ethnography.
Sol Lennox writes :
“Performance ethnographies (Conquergood, 1985; Fabian, 1990; Denzin, 2003), and performance autoethnographies (Douglas 2014), are arts informed research practices that include the creative, embodied, subjective and emotional aspects of life. At their best, performance ethnographies are a holistic approach to the examination and presentation of empirical data; they draw upon the sensuous, the somatic, the spatial, and the temporal components of the study; they situate the researcher within the study;they are highly critical and self reflexive They challenge dominate modes of representation (St Pierre 1997); they foreground the body as something that people can know with, about, and through (Chawansky 2014)”.
Sol Lennox’s ethnographic study of boxing was used as an example of how the method can inform the research findings:

I described how Sol had decided that in order to convey one of the key findings from the project, that of sweat, he presented some of the data while undertaking a boxing warm-up. Sweat he mentioned is much harder to represent well in writing.
“Our body is not primarily in space: It is of it.” (Merleau-Ponty, 1962)
Students were also shown how Sol had used performance ethnography as a means of analysing his data by taking key parts of video recordings that related to his research questions, and re-enacting the data in order to better understand the research participants.
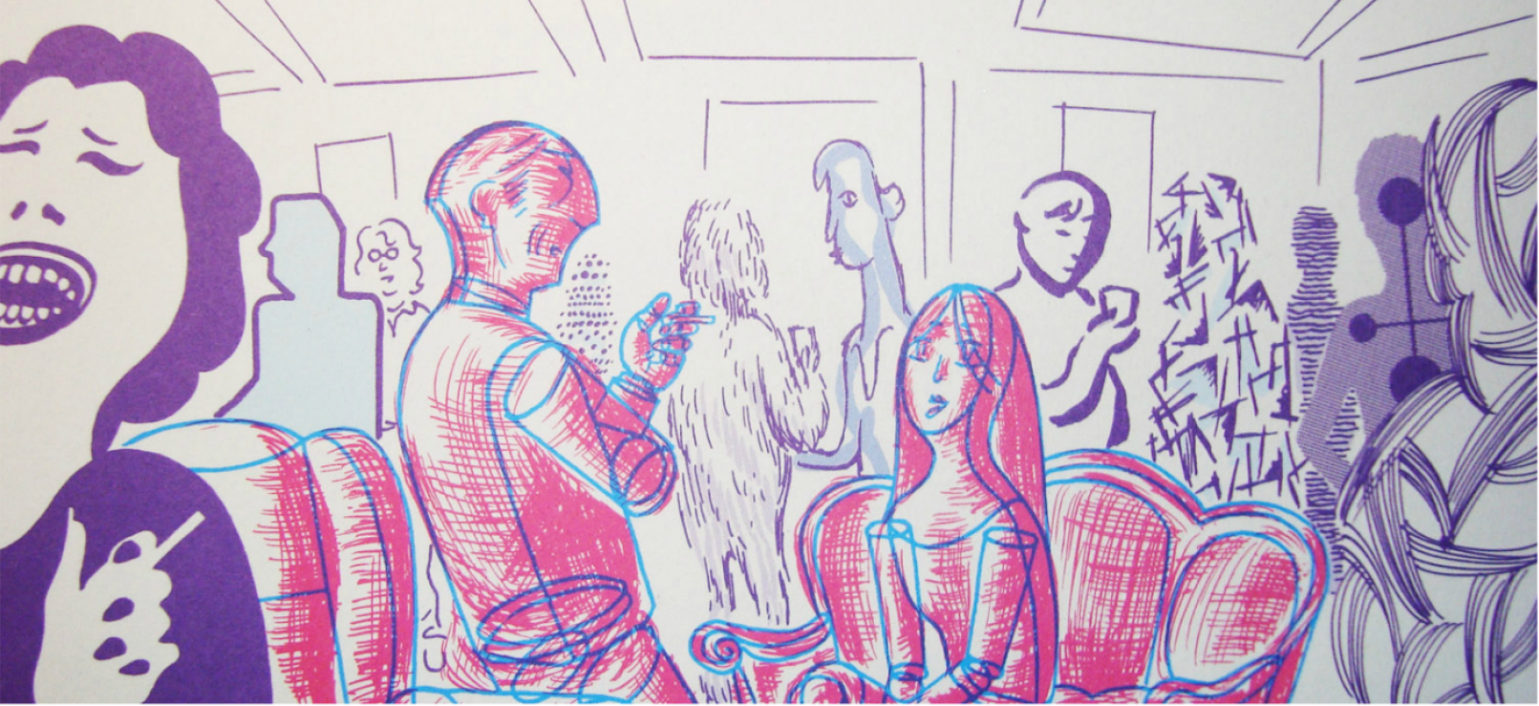
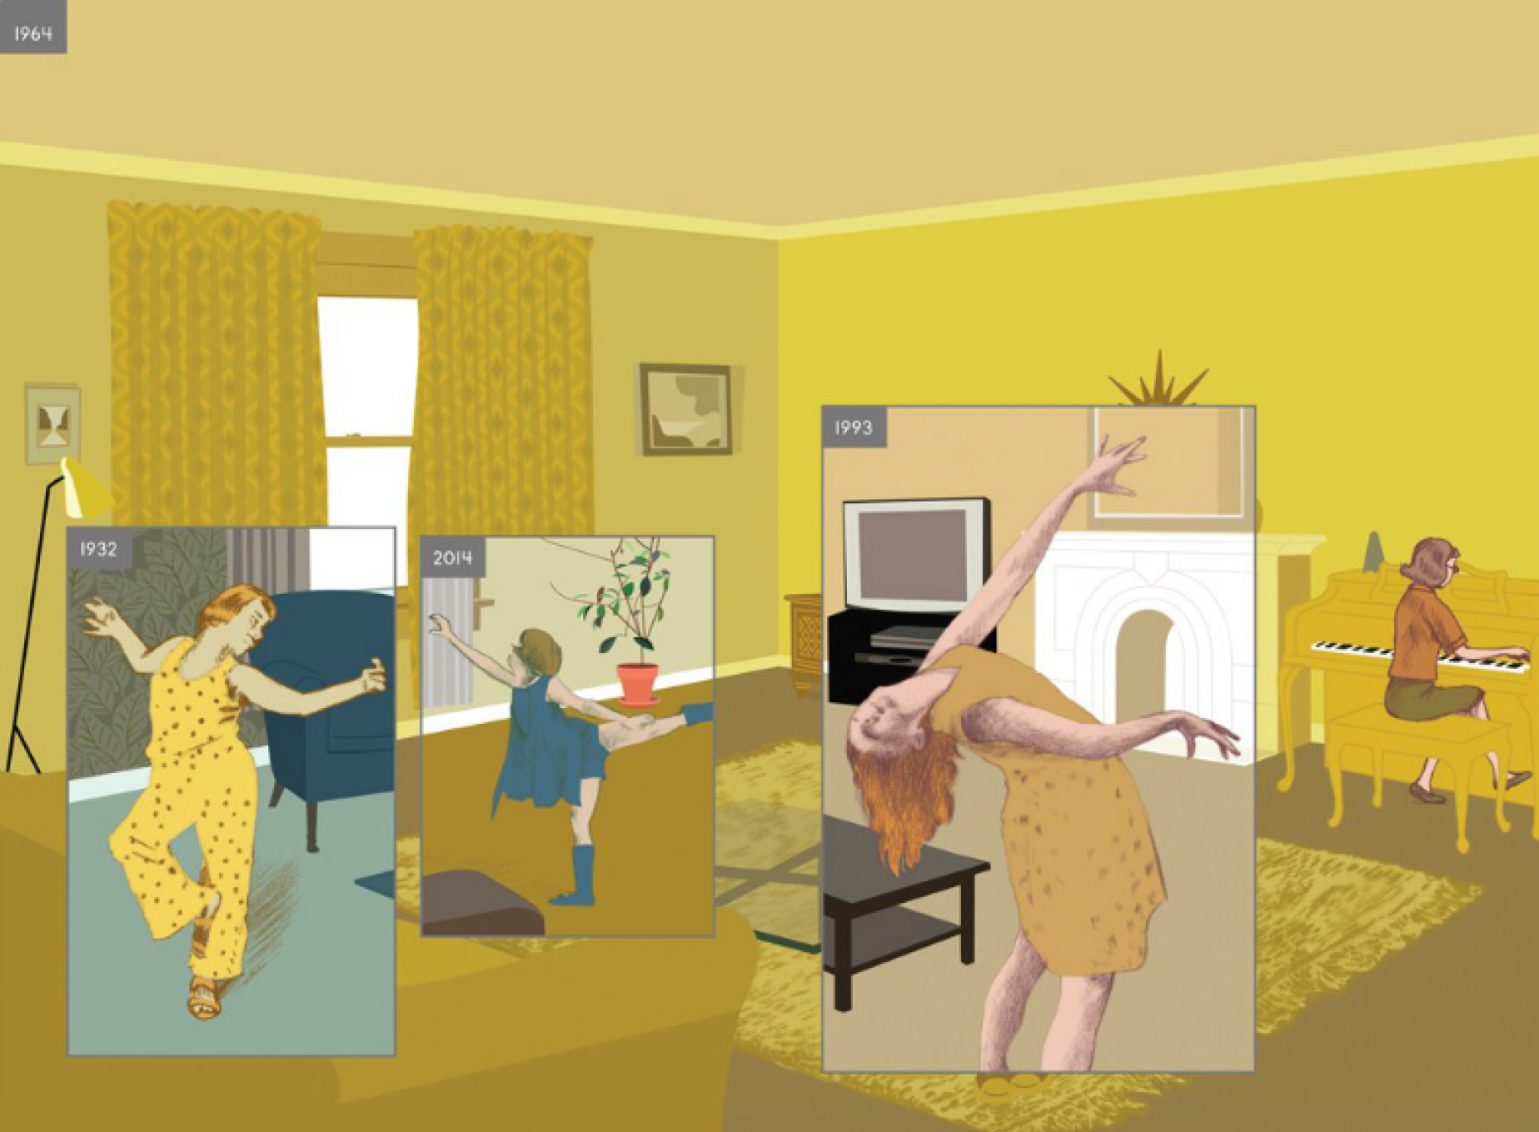
Students were invited to chose a video relating to their current dissertation or other research topic. They started by making notes about how their chosen video informed their interest. Students were then asked to work in threes, to re-enact the video and record it, making decisions about how to embody any human movement in the original footage while later documenting what they had learned from the process.
 Image: Re-enacting movement in the Sia Chandelier music video, Dylan Yamada-Rice & Lisa Procter
Research is performative rather than informative (De Garis, 2000). In this way performance ethnographies challenge the dominant modes of representation.
Students were asked to think about whether they thought performance ethnography could be applied to historic data. In relation to this, it was shown how Chow and Lennox had explored this through the use of photographs, illustrations, and newspaper reports from 1889, to re-imagine and re-enact the first fifteen seconds of the infamous 1889 bare knuckle bout between the ‘Boston Strong Boy’, John L. Sullivan, and Jake Kilrain:

Knowing Through Making
Drawing on the work of Ingold (2013) in his book ‘Making’ we discussed how humans have always gained knowledge via making from agricultural practices and beyond.
“Making creates knowledge. Anthropology, archeology, art and architecture are all ways of making, and all are dedicated to exploring the conditions and potentials of human life.” (Ingold, 2013)
This was broken down further to think about two types of making that can produce knowledge: (1) Our own making, and (2) What we can understand through imitating others’ practices (This is more similar to performance ethnography).
An example of the latter was shown in relation to the work of Katy Carroll AKA Duchamp Tourist who has followed her interest in the artist Duchamp by visiting the places he went/ lived, collecting air and other relics from those areas etc and embodying many of his practices. This could be seen as a form of knowing from the inside.

In relation to knowing through drawing students were asked to explore what they could learn about the artistic practices of the person sat next to them by simultaneously imitating their production of a self portrait.

Following this, participants were shown a video of a young child playing on the VR game ‘Job Simulator’. Then using drawing as a means of transcription, they were asked to produce a transcript of an aspect of the child’s movement, i.e. his head, feet or arms and then to reflect on their drawn transcripts for what it showed them about this child’s use of VR.
Finally, examples were shown of my research into children’s use of virtual reality and how at different points of the study I used drawing as a means of knowing. This included as transcription, analysis and linking the analysis to theory.
 Image: Drawn transcription by Dylan Yamada-Rice
Reading: Denzin, N. (2003) Performance Ethnography: Critical Pedagogy and the Politics of Culture. London: SAGE/ Ingold, T. (2013) Making: Anthropology, Archaeology, Art and Architecture. London: Routledge/ Pearson, M. (2010) Site-specific Performance. Palgrave.
Research for VR Design
This workshop began with an overview of the Children and Virtual Reality (CVR) research I conducted for Dubit, a company specialising in strategy, research and development of children’s digital media . I demonstrated the project methodology and how it was used to inform the design of VR content and technology.
I talked about my belief that knowledge gained from VR being developed for gaming and as art needed to inform one another. VR experiences in gaming are made in order to be commercially viable. However, the nature of the medium is such that we still need a lot of experimentation in order to understand what is possible, and what audiences will engage with. I demonstrated to students how narrative design will need to be thought about differently depending on the device they are creating for.
Image: CVR study
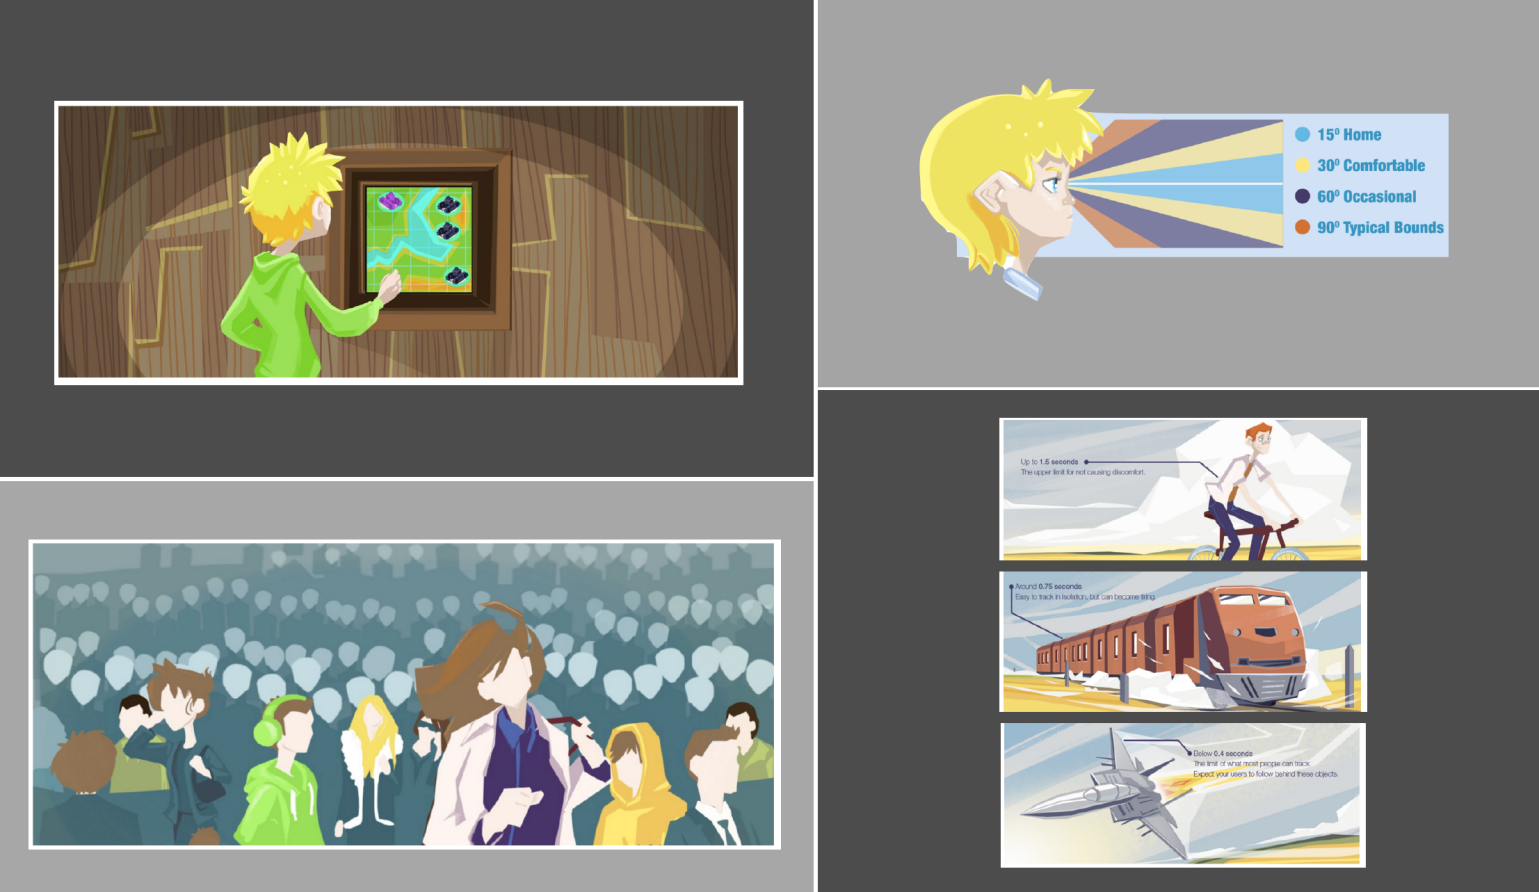
Students were introduced to a number of best practices for VR development that were included in the CVR report, such as:
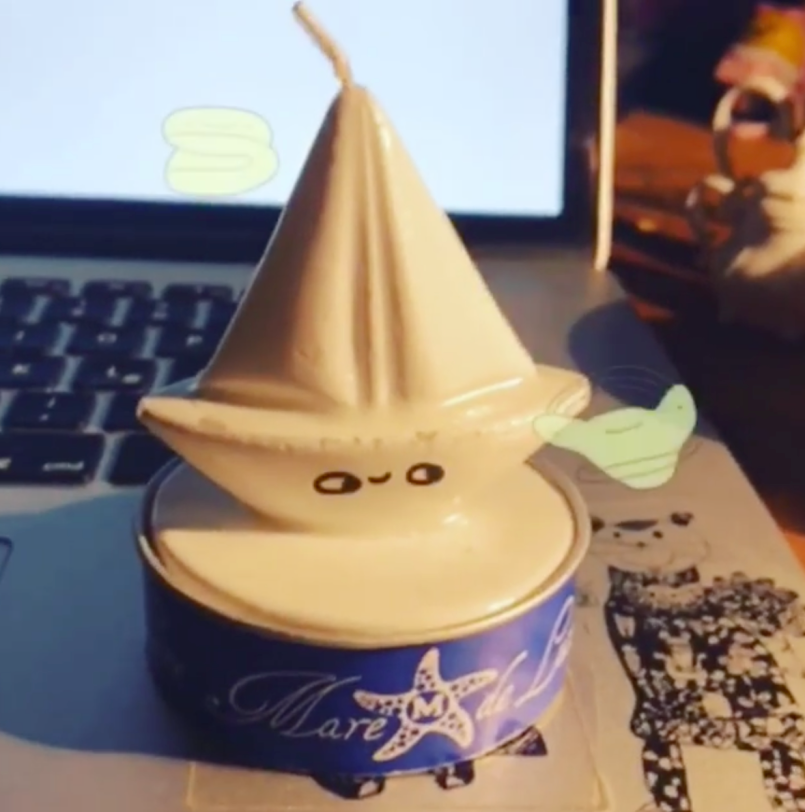
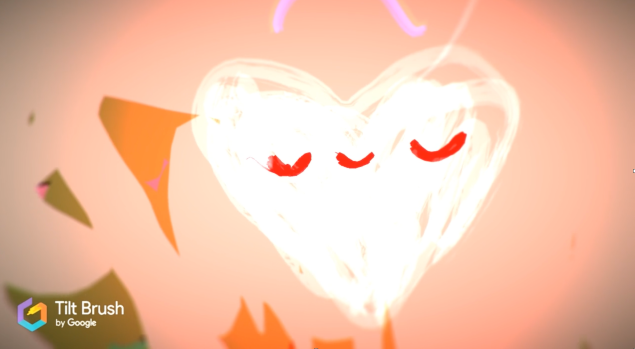
Next our guest lecturer Deborah Rodrigues, Gluck Workshops shared some of her work in VR and AR. She began by introducing the students to the AR work she was producing for her Pictoplasma keynote that year (2018):


Deborah shared a link to an exhibition she had created in Google Tilt Brush called ‘Friends in VR’ , which she designed for users to add their own artworks to the collection so that it becomes ever expanding. You can download it here.
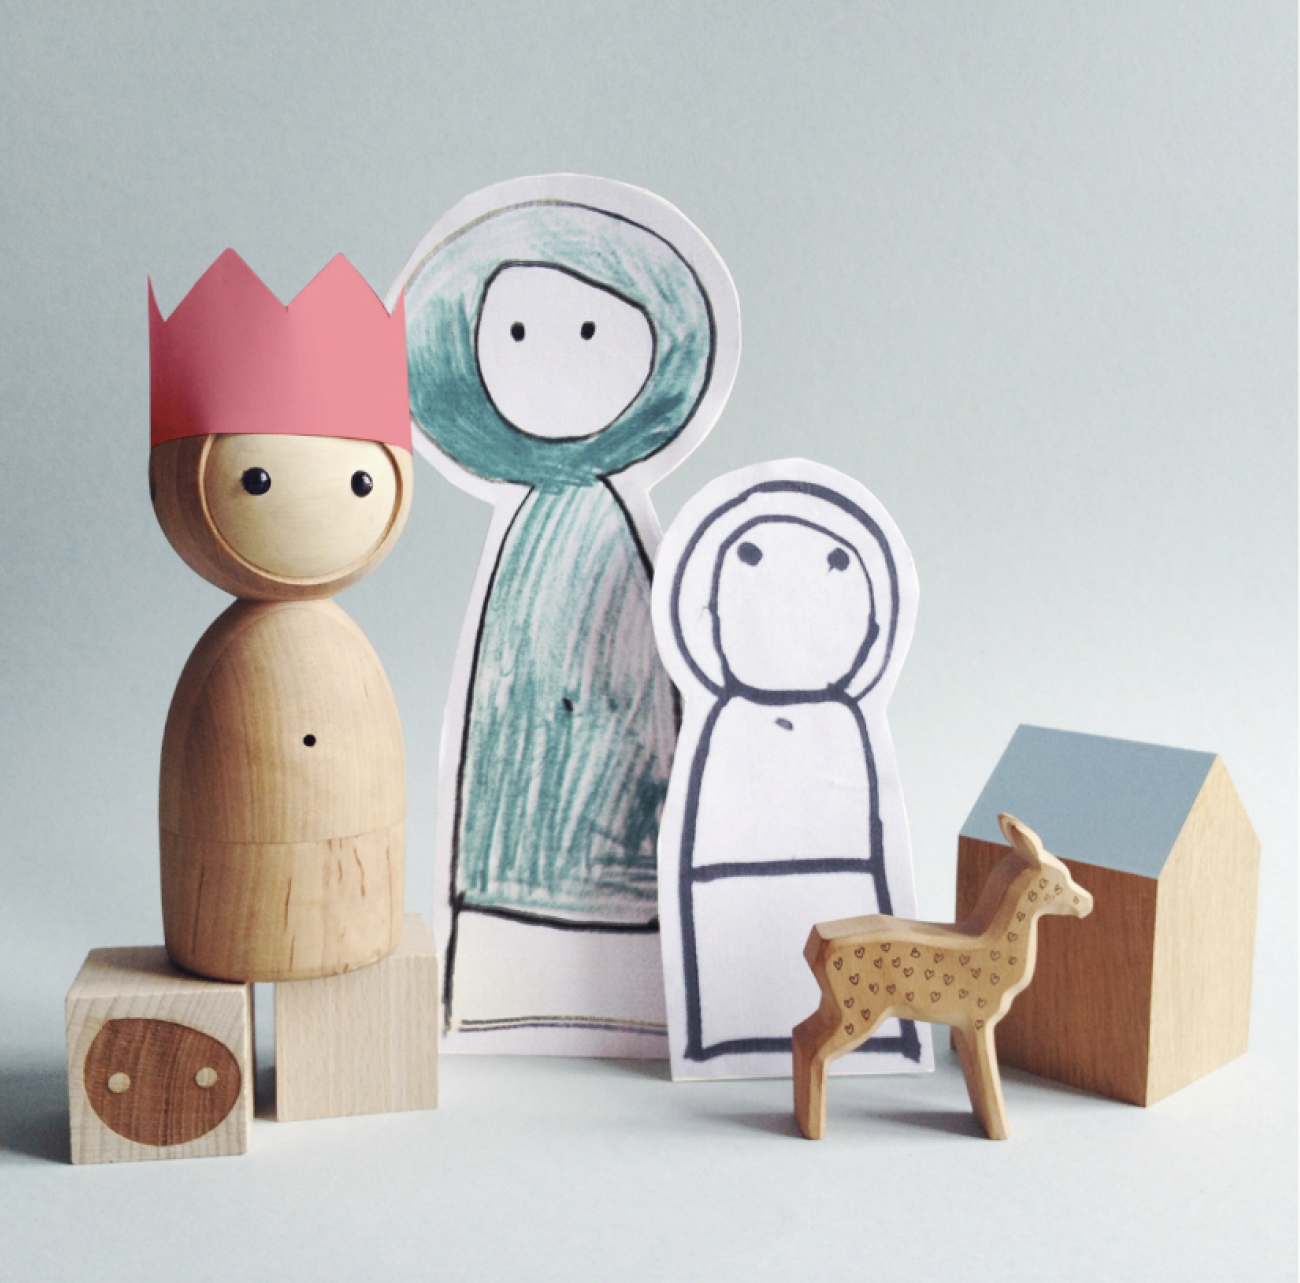
Finally, Deborah and I talked about our involvement in the RISE-funded MakEY Project where we were looking at differences between how children create with physical and virtual materials as well as how they play with a physical Avakai doll in a virtual world created by Deborah. In that project we used an HTIC VIVE Tracker to take the physical doll into the virtual world.


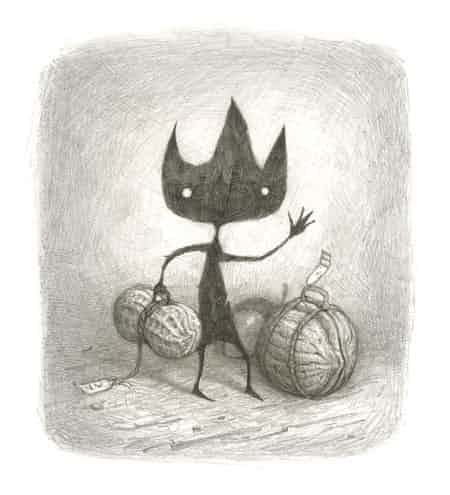
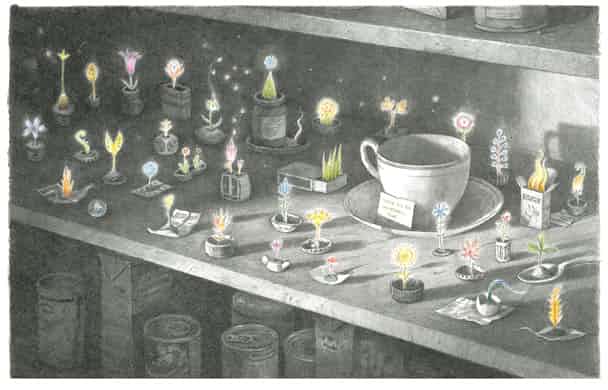
 Images by Deborah Rodrigues
Practical: Using the book ‘Eric’ by Shaun Tan, IED students were asked to build an analogue model of a VR setting for the story. They were asked to think of how they could tell the story in a non-linear way. Also not to include the character Eric but to instead allow the audience to understand Eric purely from the contents of the setting. In other words to embed the narrative into the set design. We then used a 360- degree camera app to photograph the sets from the centre and watched the results on simple cardboard VR headset. In this way the creations were used as a prototype for a potential VR design.

We then compared and contrasted the models to understand the similarities and differences in the designs. The most successful elements could then be used as the basis for a VR build.
Multimodality & Information Experience Design
Information Experience Design (IED) work is multimodal, and so, the workshop showed students how an understanding of multimodal theory could be used to expand their IED practice. There was a focus on:
- The meaning of a mode
- What it means to transduct information from one mode to another
- The ways in which modes relate to culture and history
- Information that is lost and gained when one mode is used over another
The workshop started with an outline of multimodal theory and in one practical students were asked to observe one mode across the ground floor of the RCA White City campus (where we were based) and find a way to represent it, i.e. to see how the building smells and find a way of representing it. Having done this with groups of social science students in the past I was surprised when none of the IED students choose to represent the mode they were representing in writing.
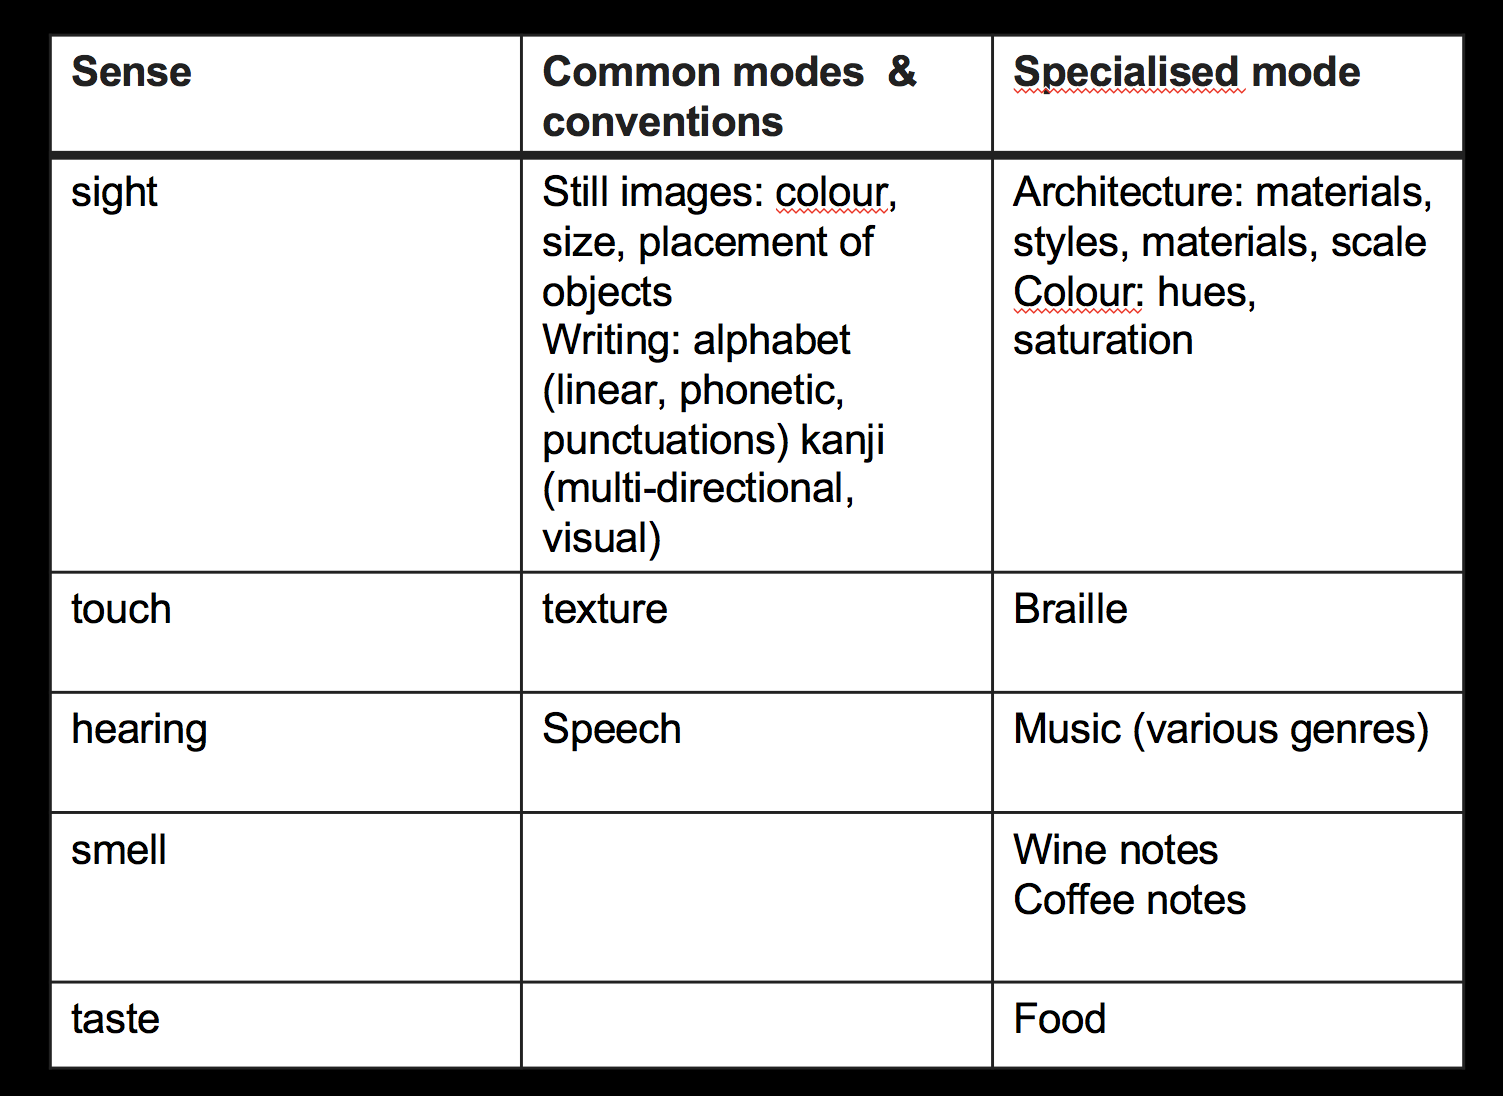
Much of the literature on multimodal analysis within the social sciences uses a form of transcription that breaks down the multimodal whole by transcribing each mode into words and placing them in a table (such as the example below by Mavers, 2005):

Table: An example of a multimodal transcript by Mavers, 2005

Since that workshop I have been thinking more about IED as a process of experimentation, whereby information is reduced to representation in a collection of modes, a process that often involves investigating how the design is altered when some parts of the information are transducted from one mode into a range of others. In the process of doing this, there is also a great deal of experimentation with materials too. As well as a constant shifting from obvious modal choices and materials to more abstract ones to see how it affects the experience of the information being conveyed.
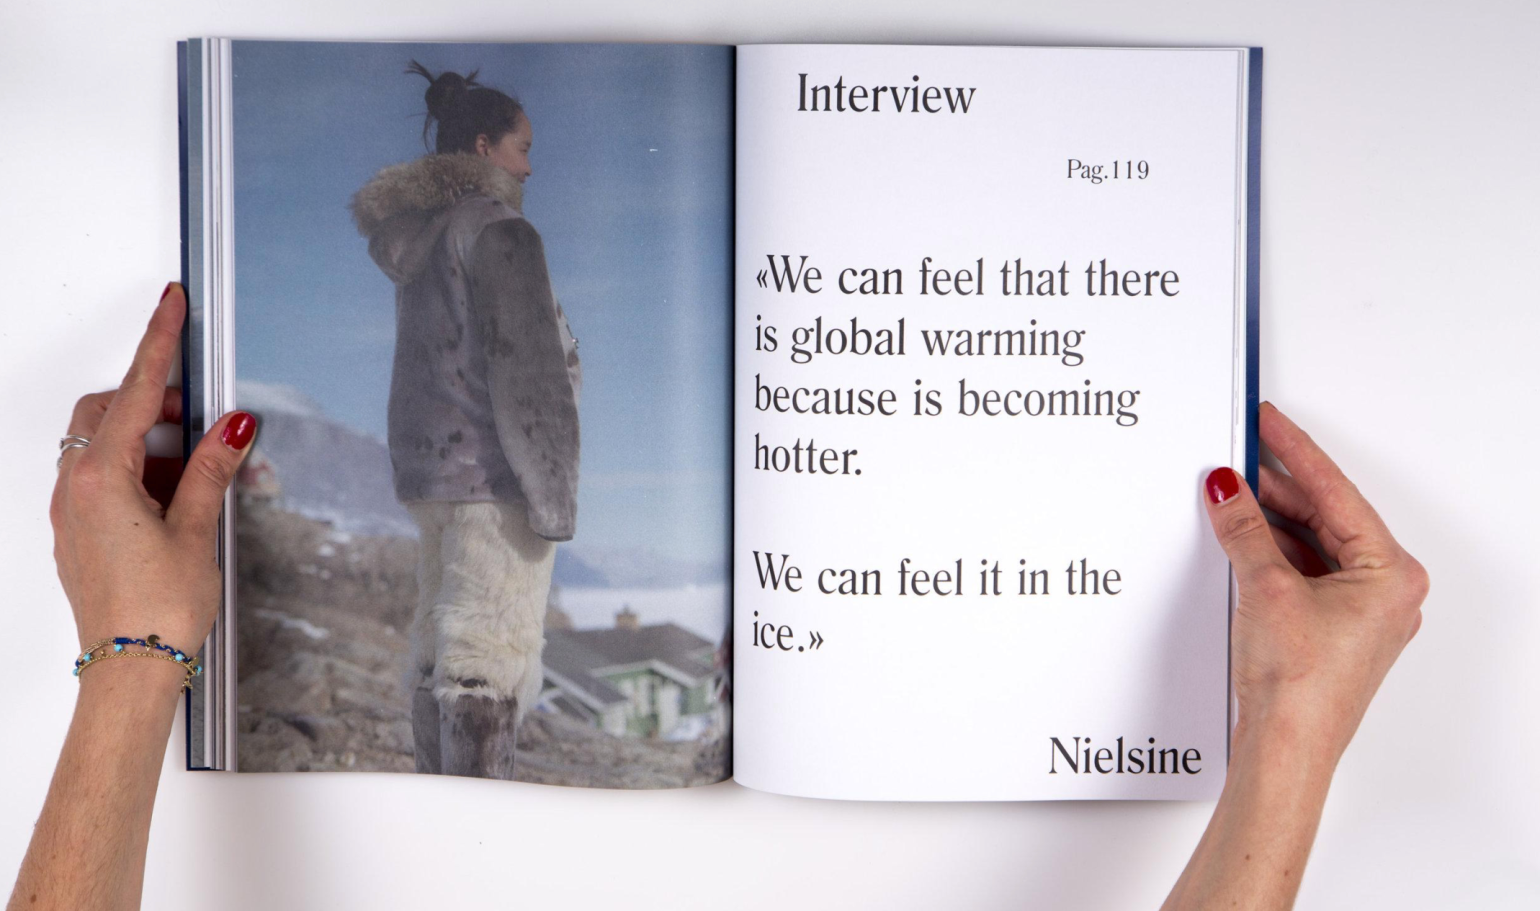
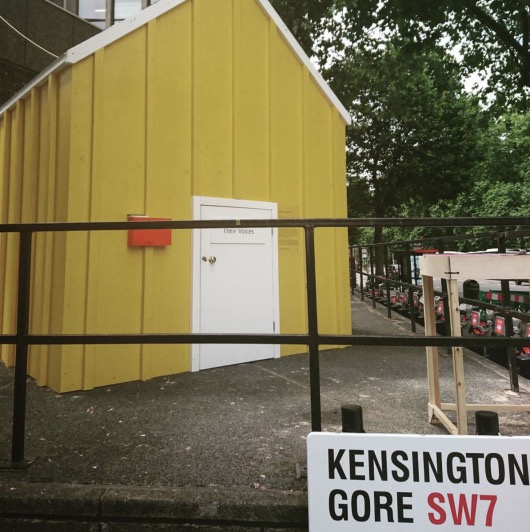
The work of some IED graduates was shared as a means of showing the different modes they had used in order to convey information on a specific topic. One example was Sylvana Lautier’s final IED work ‘Their Voices’ about children’s perceptions of climate change.
“My project visualizes the impact of global warming in Uummannaq, a small and remote island off of Northern Greenland. It is a pristine and awe-inspiring landscape of striking beauty and purity. The local population is much affected by melting ice, as well as by ‘black winds’ which bring pollution from all over the world. Their Voices immerses you in the world of Inuit children, with their unspoilt emotion, unfettered intuition, and purity of intention. This new generation aspires to a Western way of life, and thus the Inuits may lose their traditions and culture.” (Sylvana Lautier)
Sylvana’s work took on many forms over the course of her final year on the MA in IED. For example, she travelled to Uummannaq in Greenland to interview children about their views on climate change. She turned these interviews into a photographic book. She also produced a documentary film. Following these two pieces of work she began to explore how to enable her audience to understand the importance of the children in her work. To do this, Sylvana built a traditional Greenlandic house in children’s proportions in which she installed her documentary film. The size of the door forced the audience to bend down to enter into her installation thus loosely embodying the proportions of the children in her study as they did so. Inside the house Sylvana projected her film through a mirror on which ice was melting. The audience was invited to touch the ices and move it across the mirror. As the audience did so ice melted and the image of her documentary film became distorted by the pattern of water. In this way the materiality of ice and water a reoccurring theme from Sylvana’s research findings were introduced into her final IED installation.

I elaborated on this by explaining how in my work in games design it is important to think about how narratives or toys that have physical versions can be adapted to digital platforms. To do so I often explore how specific elements of toys’ physical materials can be recreated in the digital. For example, what is the one aspect of the material of Lego bricks that needs to remain in a digital game about the blocks for the user to recognise the brand?
In conducting research I also analyse multimodal data in a range of modes in order to see how they afford meaning, i.e. by reducing video footage of a child playing in VR to a line drawing in order to understand movement:

Striping away all other details from the video, such as the background and the colour and texture of the child’s clothing, brought about a different way of understanding their movement when using VR.
Finally, the workshop participants were asked to think about modes in relation to senses.
There are connections between this and sensory ethnography, which iwas discussed in a seperate teaching session.
Further Reading
Jewitt, C., Bezemer, J. & O’Halloran, K. (2016) Introducing Multimodality. Routledge.
Multimodal Analysis
The aim of this workshop was to explore how the earlier transcriptions of modes that had been made as a means of exploring the RCA White City Campus could be compiled as a form of multimodal transcription and then analysed.
Before this I shared some examples of other multimodal transcriptions that have been created by social scientists:
1. Transcription of a child drawing:

2. Transcription of a TV advertisement:
3. Transcription of a child telling a joke:

4. Transcription of a conversation:
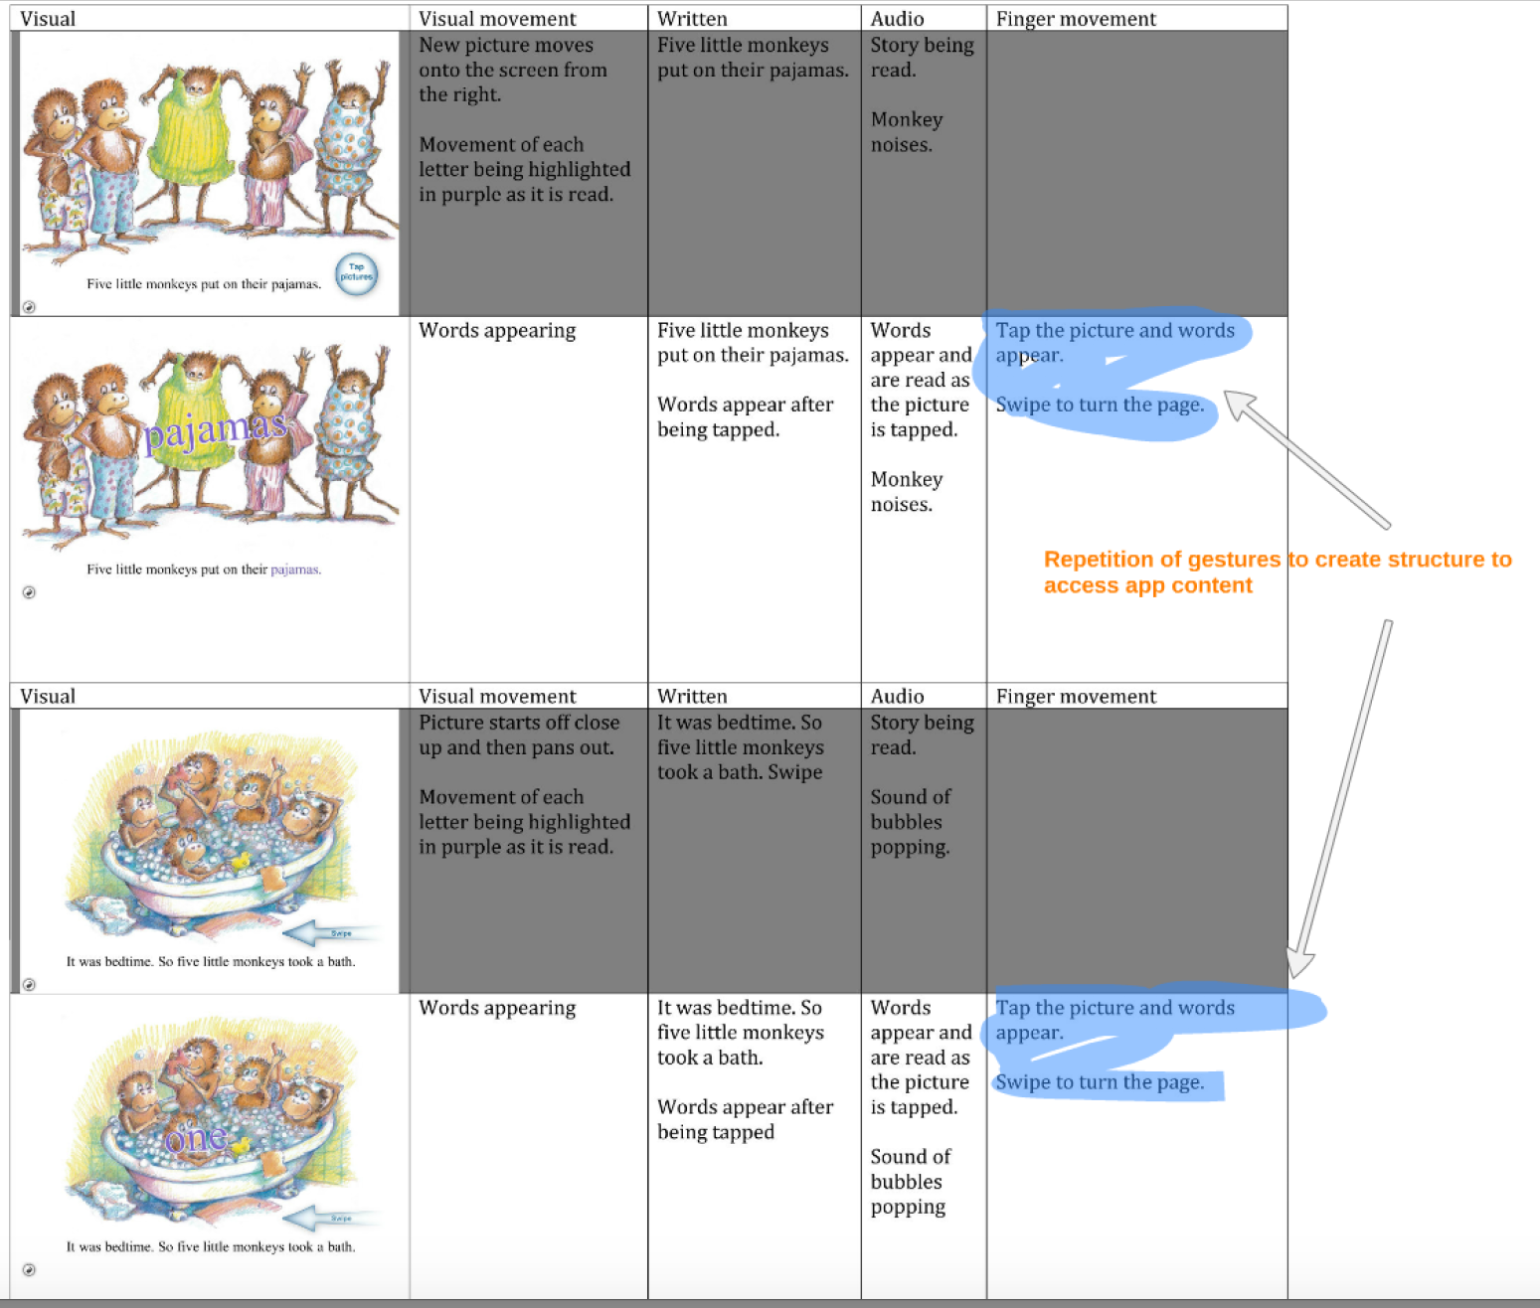
The examples above primarily use a table that is broken down to look at individual modes from the wider whole (i.e. tv advertisement, video recording of a child drawing etc). Each mode from the multimodal data is then analysed individually and transcribed in writing within separate columns. The examples above show how different researchers have chosen to focus on a range of modes depending on what the wider multimodal text/artefact is that they are studying. So for example in the last example above I was transcribing the different modes within the Five Little Monkeys app in order to better understand children’s engagement with it. The modes I decided to look at where defined by the text being an app and thus included, the visual (still or moving), writing, sound and finger gestures (that were needed to interact with the previous modes). The question of whether finger gestures are a mode in their own right is unimportant here.
The use of a table for multimodal transcription is different to the means of transcribing different modes that were developed by IED students in the multimodal workshop, which included e.g.:
- Transcription of texture using sound, photographic image and abstract image made from rubbings
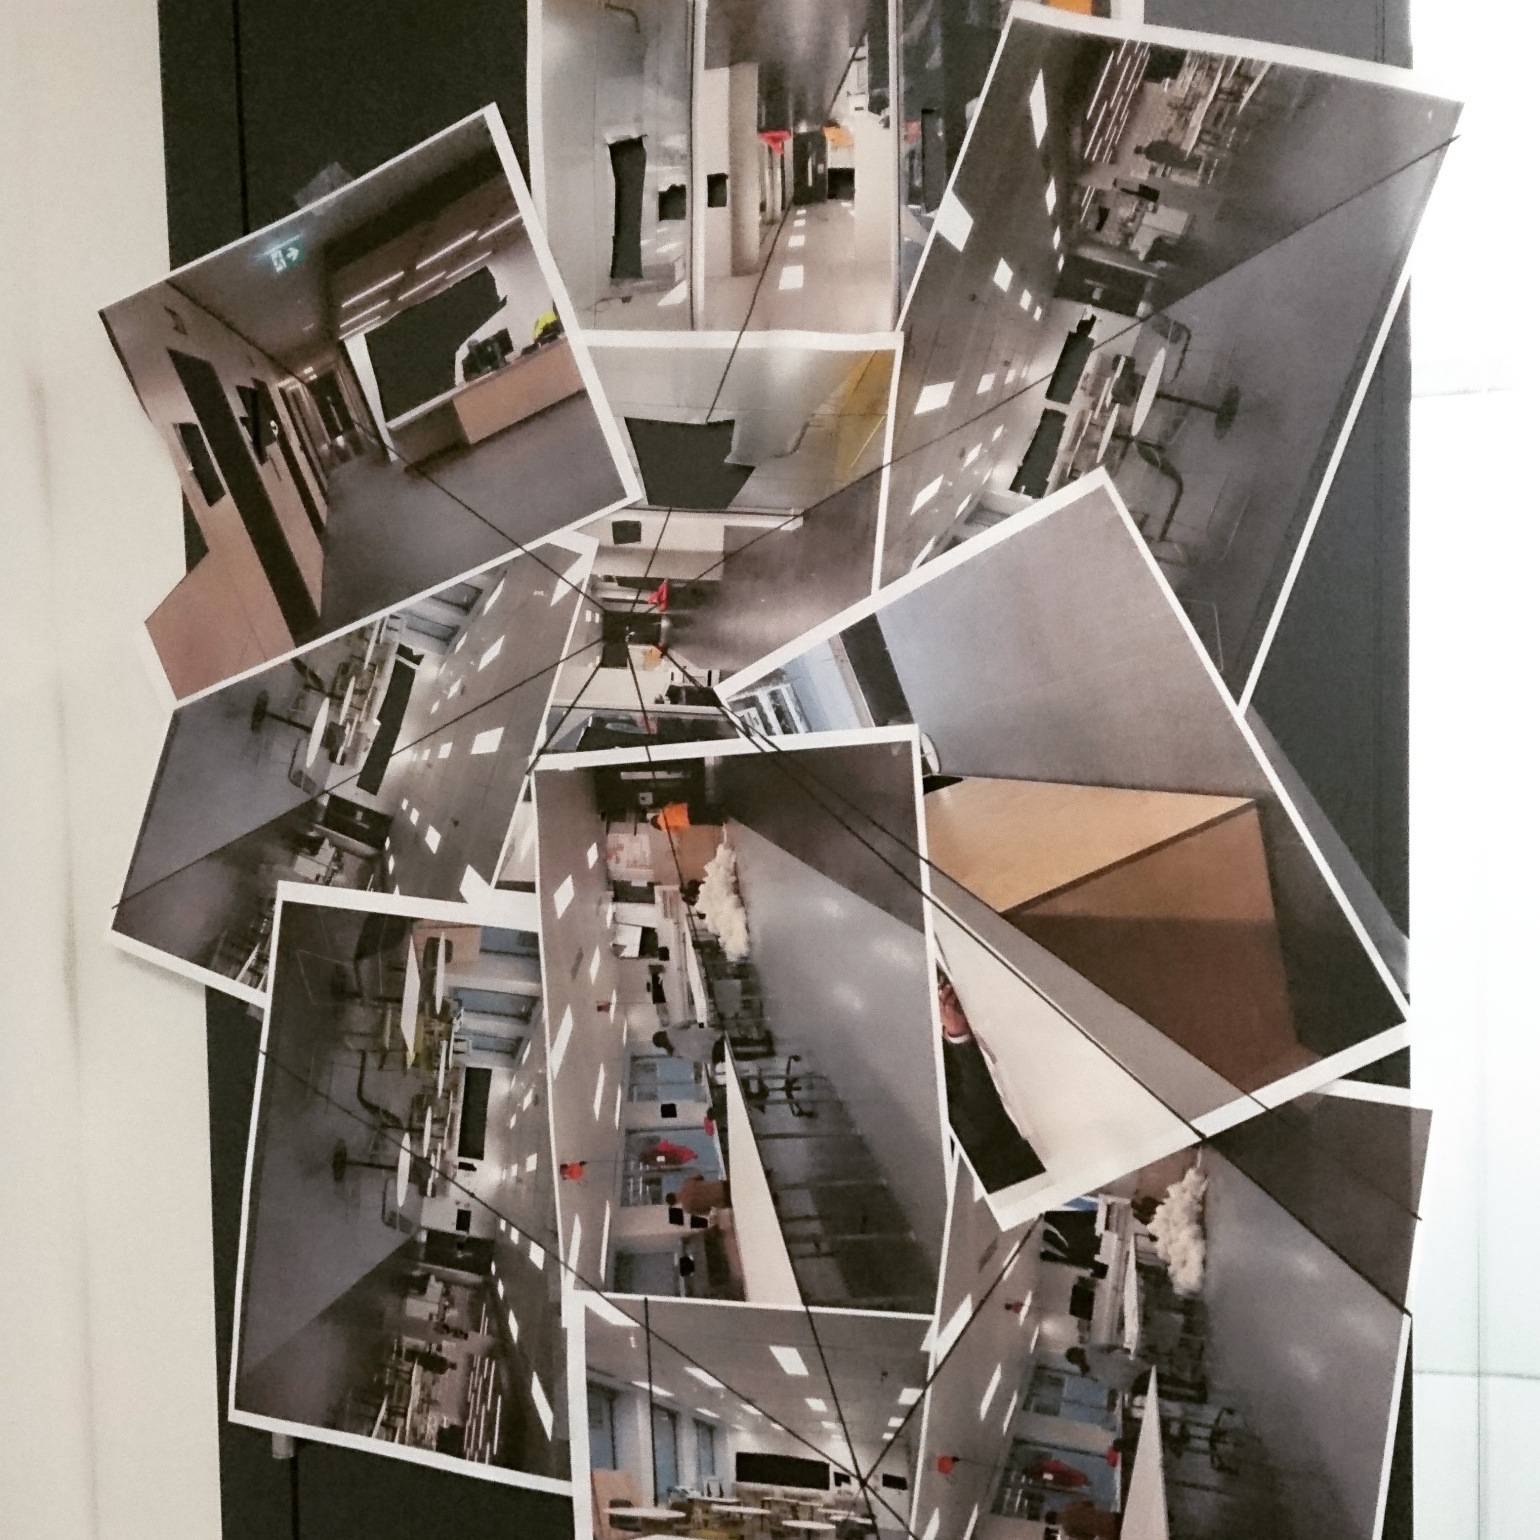
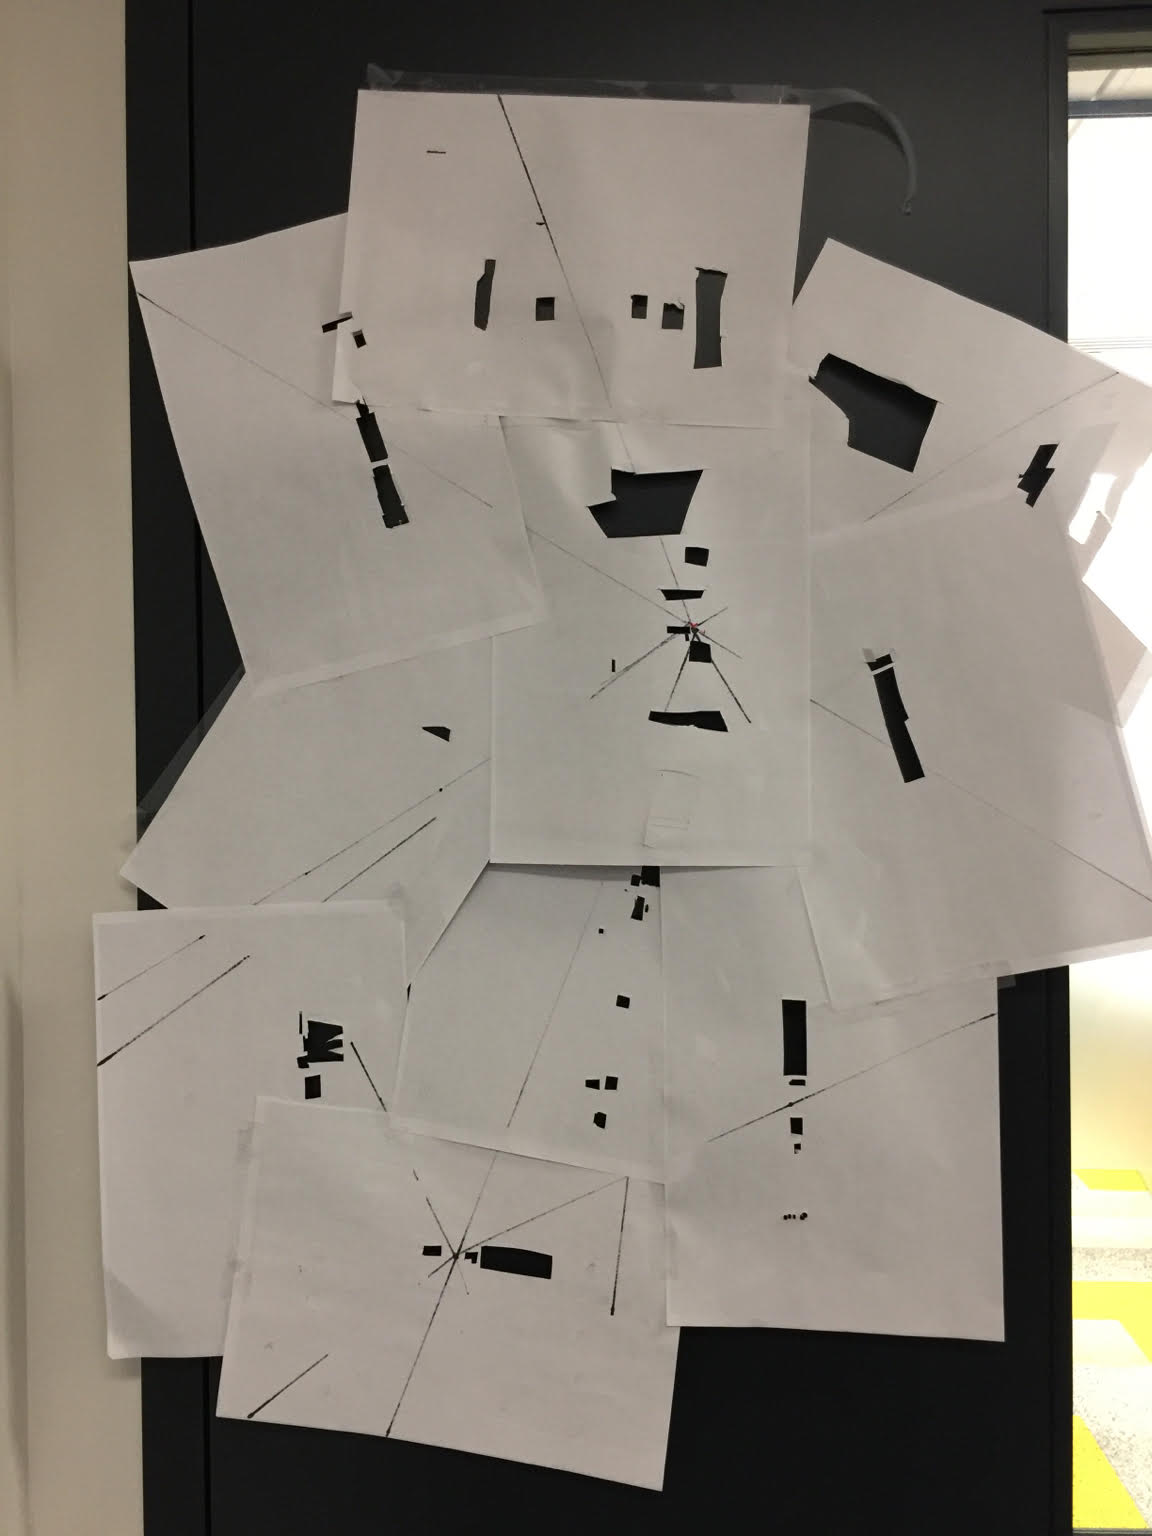
- Transcription of writing in the environment by creating colleges of photographs and cutting patterns into them
- Transcribing colour using pattern
- Transcribing smell by collating found objects
In the end combining the individual modal transcriptions was achieved by placing them onto a map of the ground floor of the White City Campus and then to explore initial connections between the modes that existed in different areas of the building.
Students considered whether it was possible to use this form of multimodal transcription as a form of analysis that could lead to recommendations for changes to be made to the building to make it feel more like an art school.
Comics & Research
This workshop explored comics as a means of collecting, transcribing, analysing and displaying research data.
The session started by exploring some examples of comics that have influenced my own research and thinking about the importance of comics to the process:


Students were introduced to the doctoral work of Richard Finn as an example of using comics as a form of ‘found’ data. Finn’s work looks at the portrayal of carer and mentally ill in graphic novels depicting mental health.

Using the examples above, Finn describes how the carer is always on the left which if analysed in relation to Kress and van Leeuwan’s (2006) theories for analysing images can be categorised as the visually stronger position.
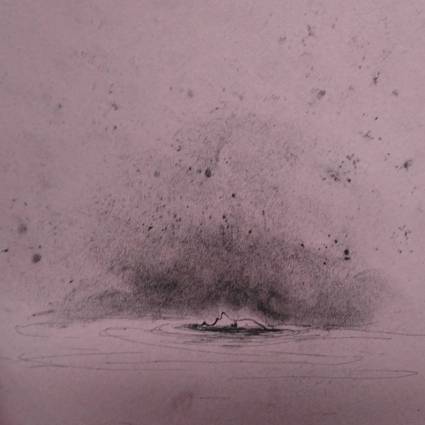
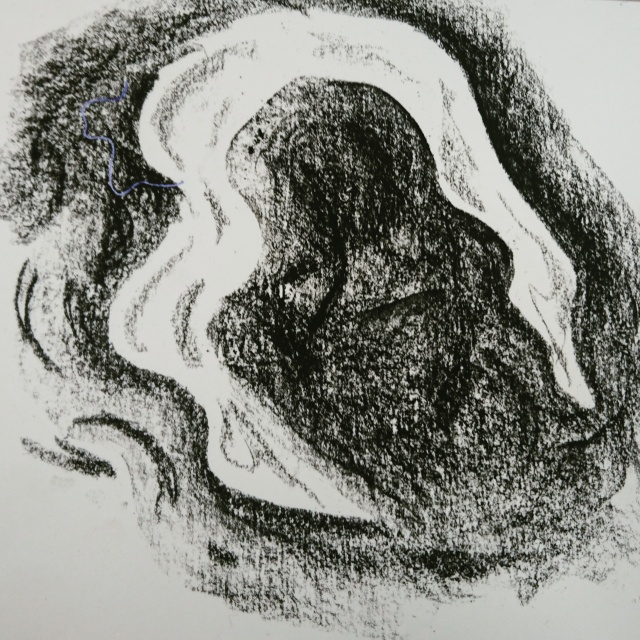
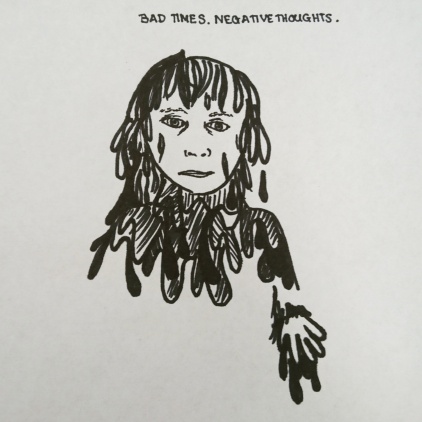
We went on to consider Finn’s study of visual metaphors within mental health comics:
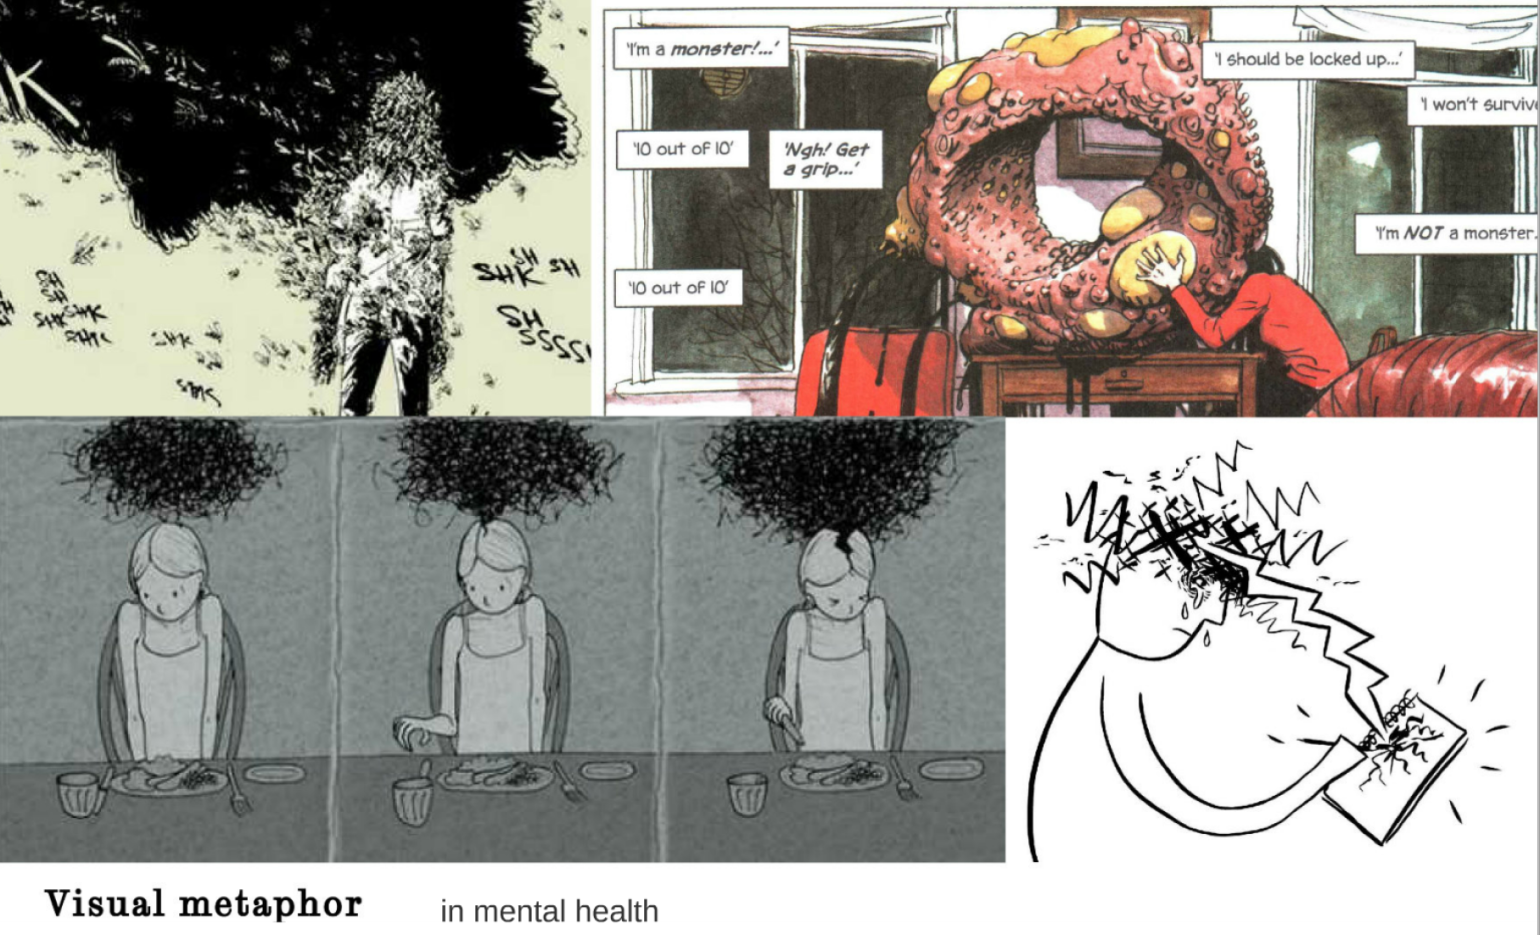
In relation to this, students produced their own images of a time they have felt mental distress and thought about what drawing could do to convey elements of that experience that words cannot.
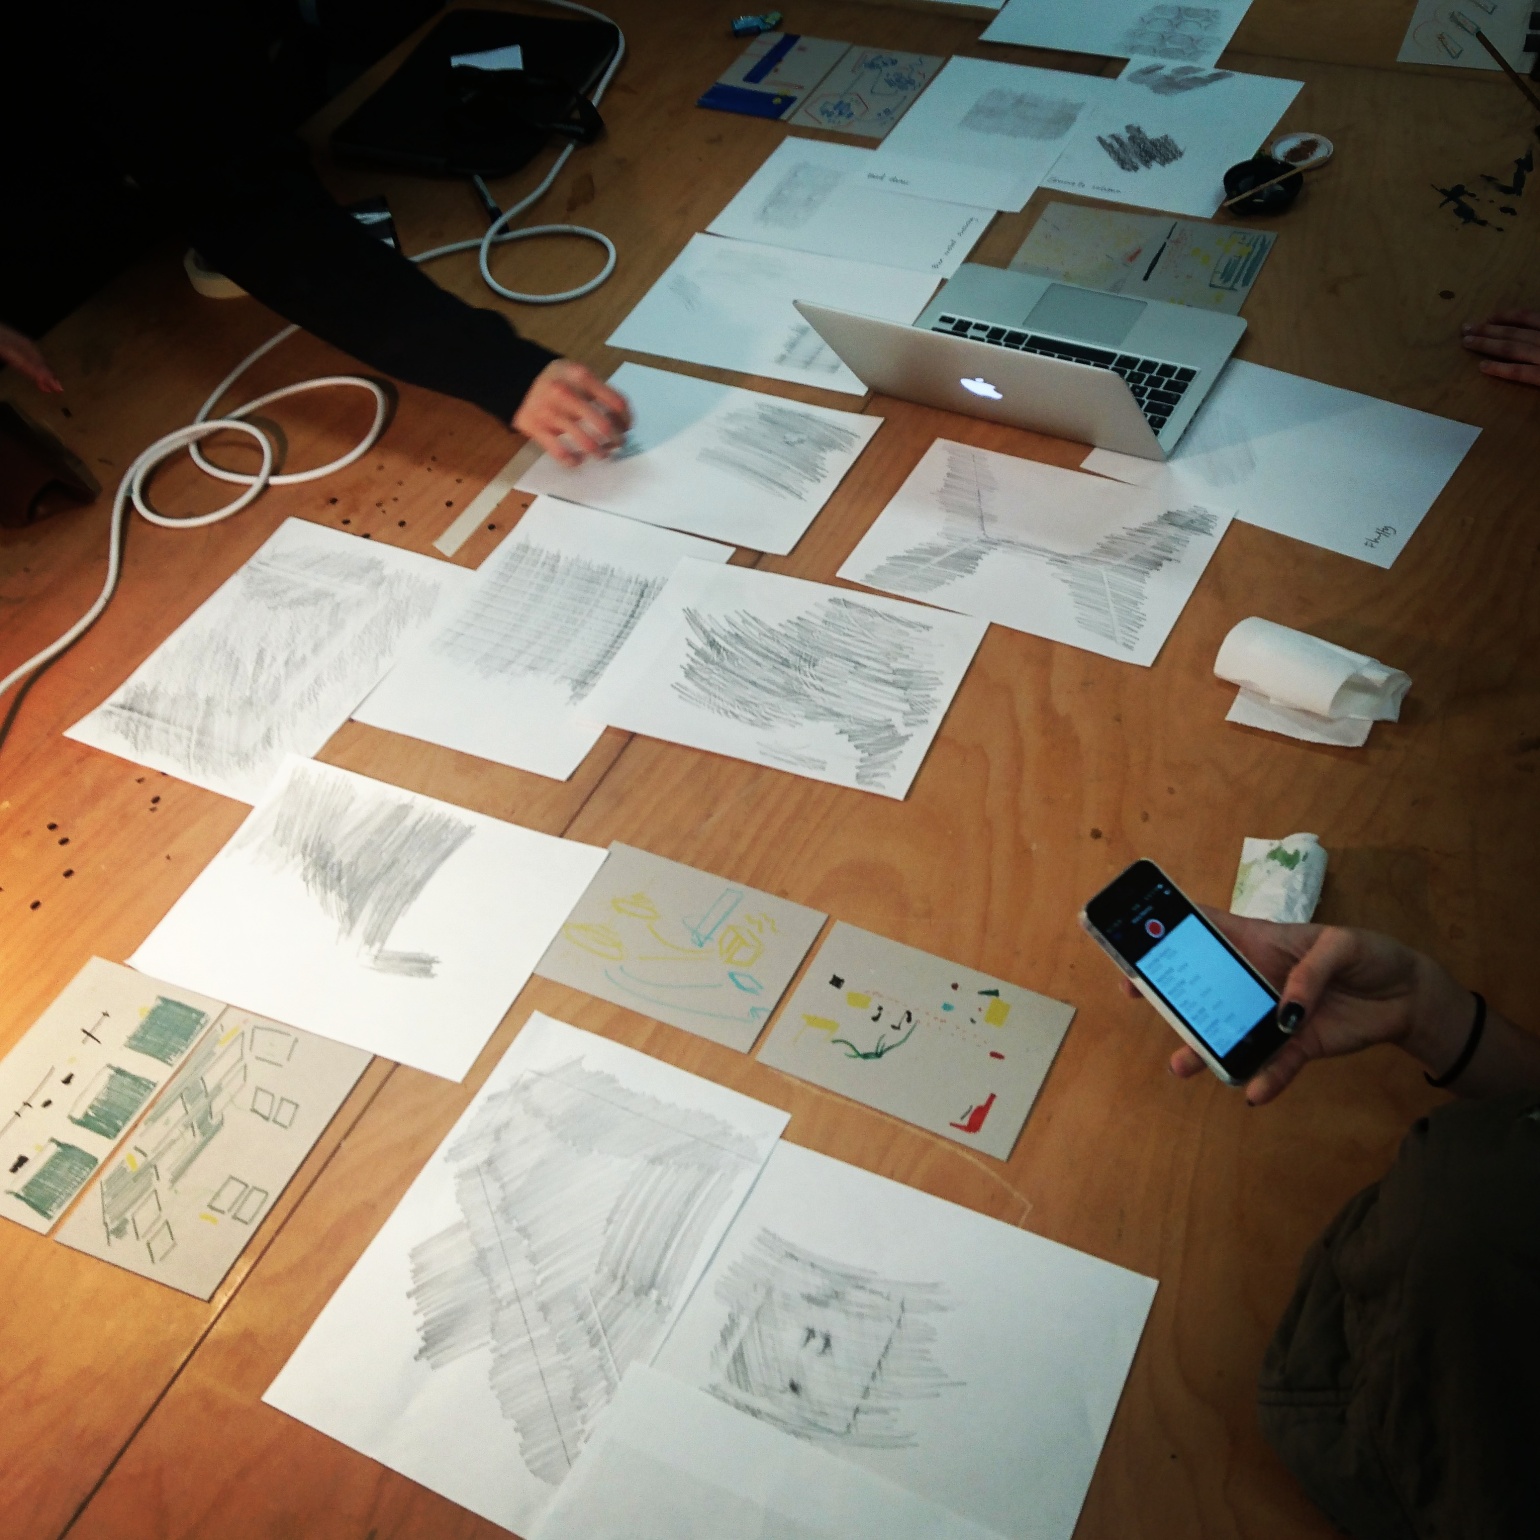
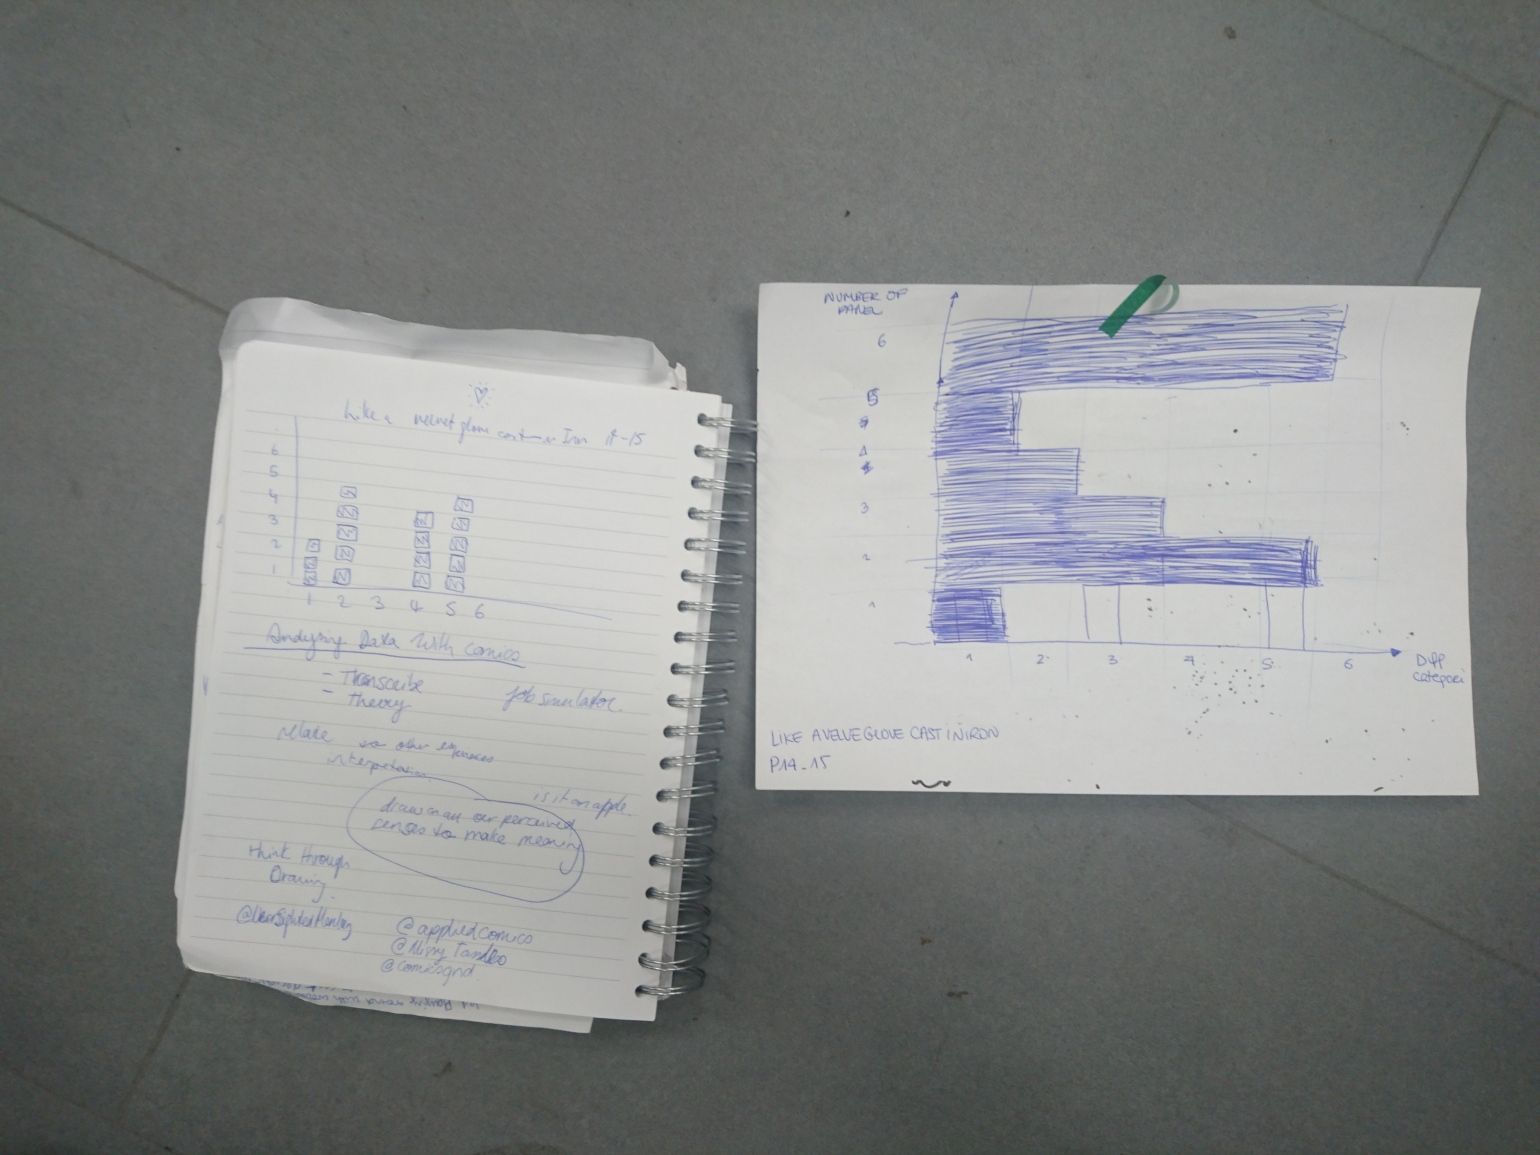
The class tried a means of analysing comics in order to produce a data set. To do this each student was given three pages from Matsumoto’s Comic GoGo Monster and asked to colour code the images in relation to aspects of the school scenes depicted and whether they related to their own schooling or not. In the following photograph blue was used to depict the familiar and red the unfamiliar:
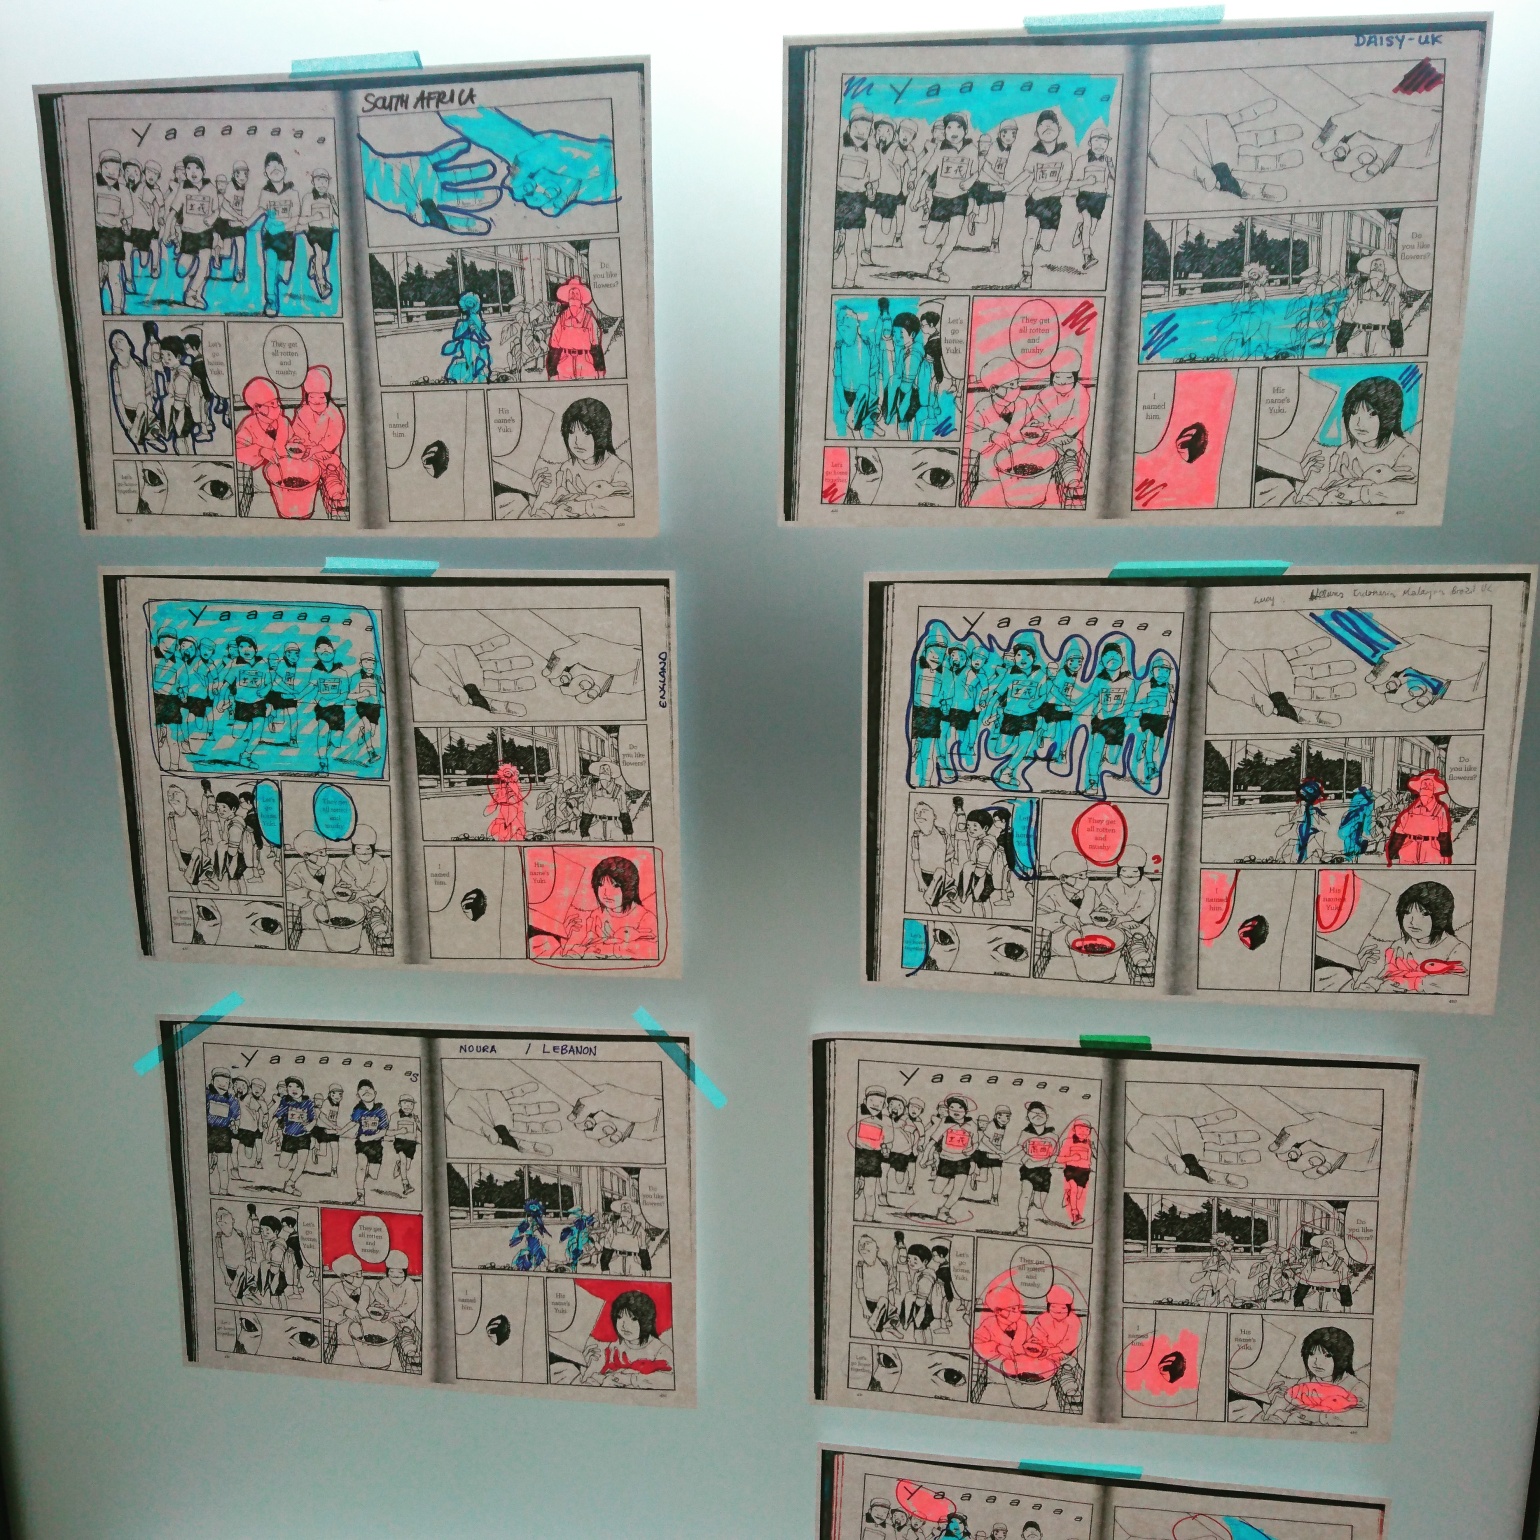
Reflection was made on the extent to which doing so brought up questions about Japanese schooling, as well as, difficulties in using this as a form of transcription. This included the need to have more information about where individual people were schooled and giving better instructions for how much of each image should be coloured.
How can comics be used to collect new data?
An example was given of the work of Matt Cheeseman et al’s ‘Phoenix Project: surviving Cancer’ where cancer patients were paired with graphic artist in order to depict their unmet needs:
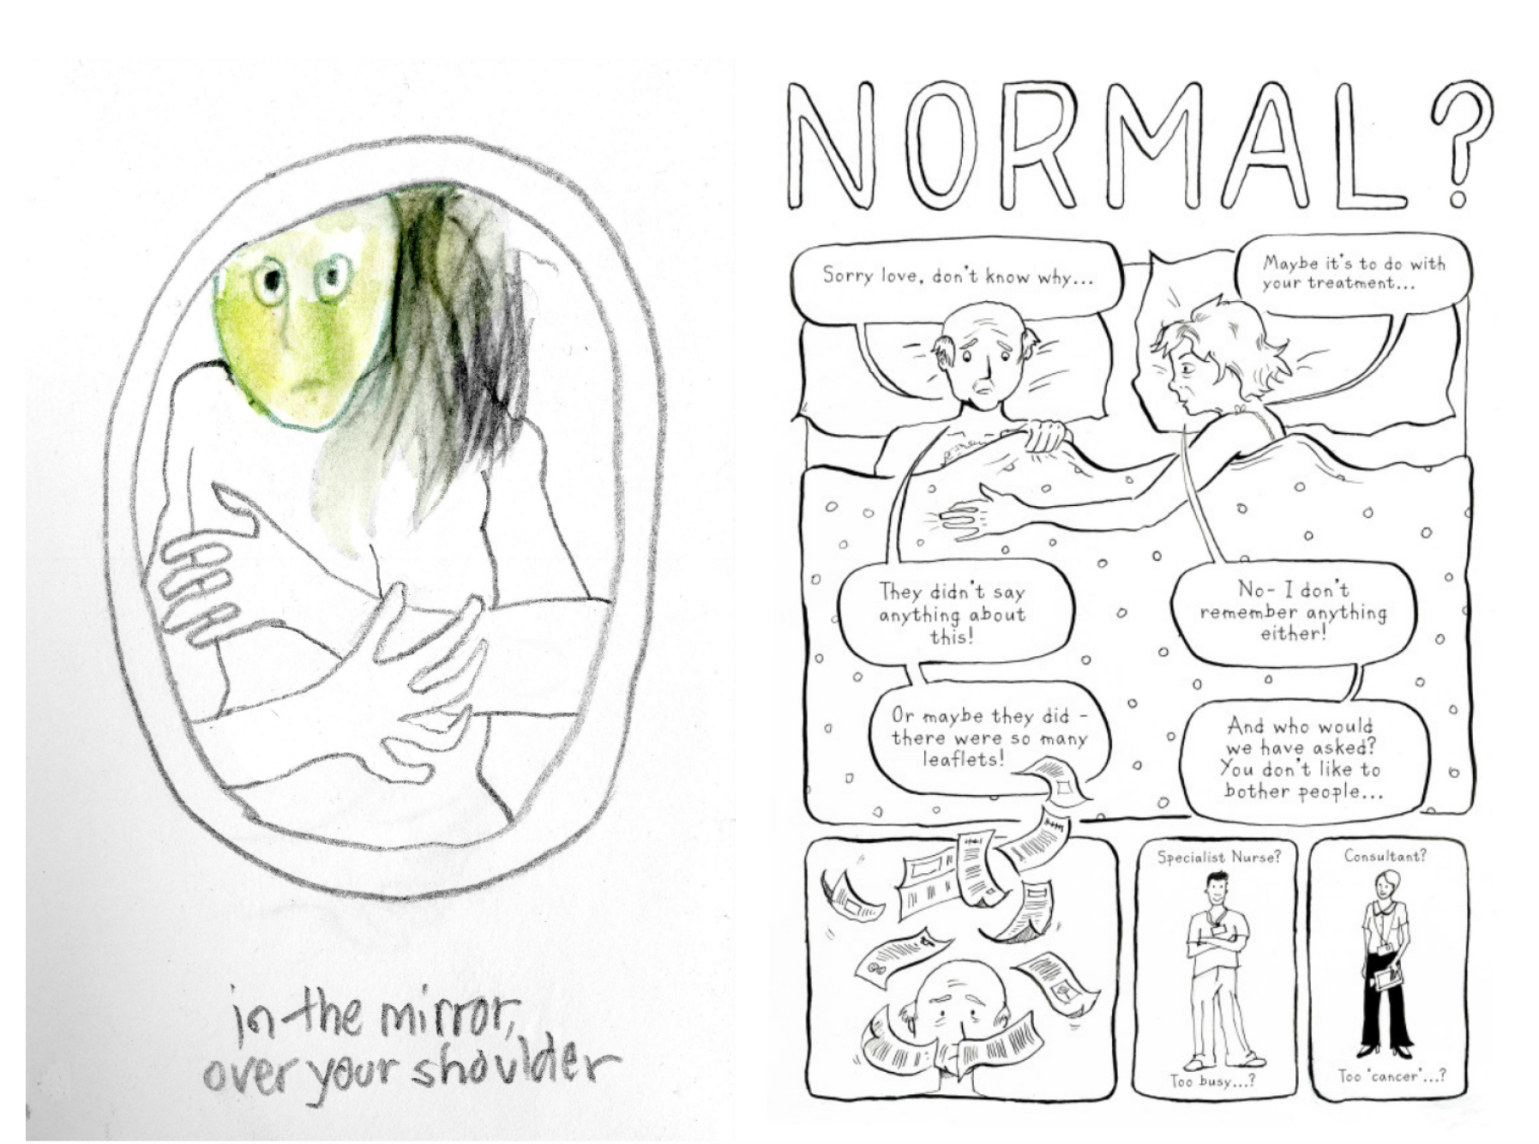
Images: the Phoenix Project
Another example was provided from my own research where I used a method of graffiting existing picture books to produce new data. In an AHRC-funded project looking at the creation of video games for hospitalised children, workshop participants were asked to alter children’s books to make them specific for children who are in hospital. Building on this, I invited students to alter a children’s book so that it reflected a specific childhood experience of their own. In the following example, on IED student recalled trying alcohol for the first time at boarding school:
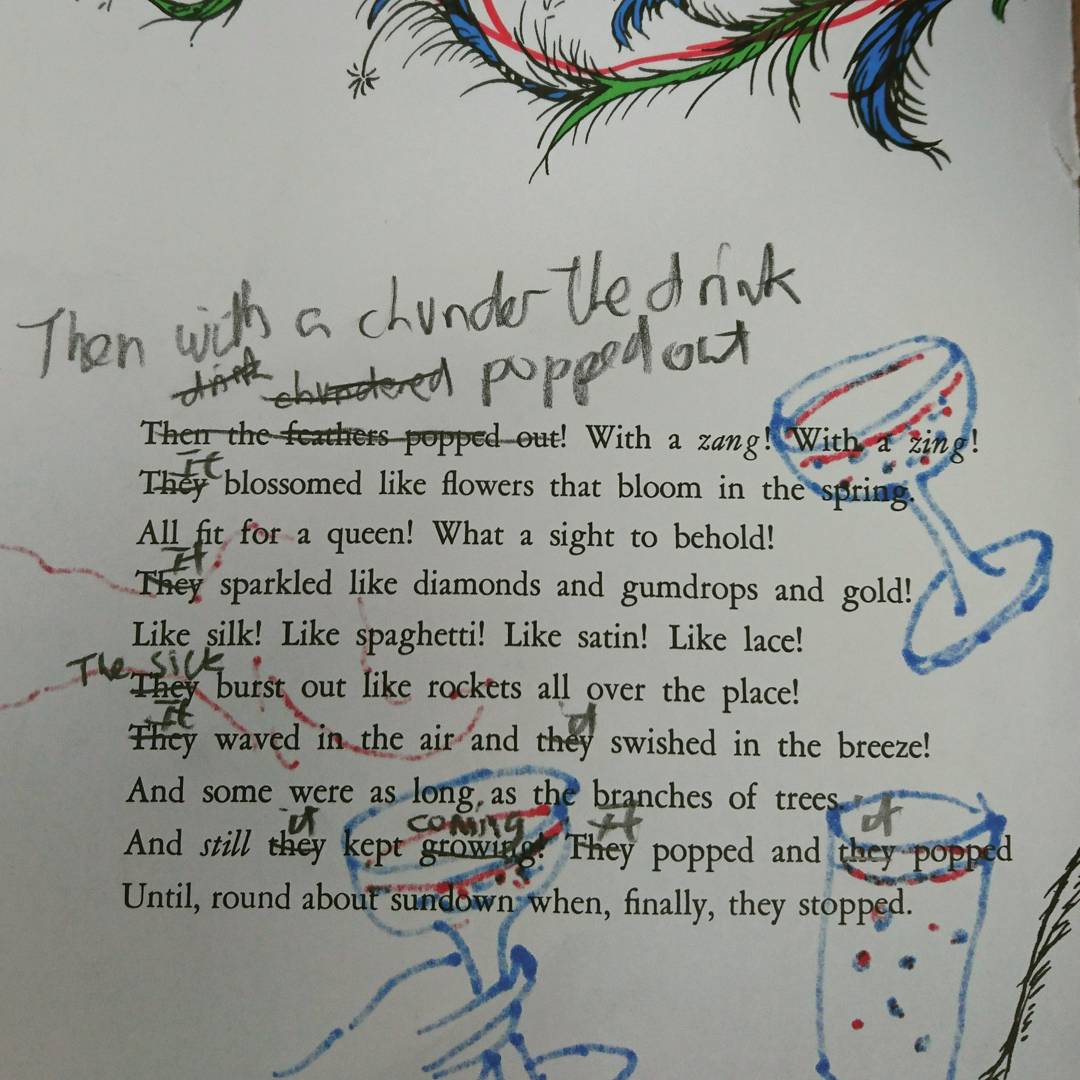
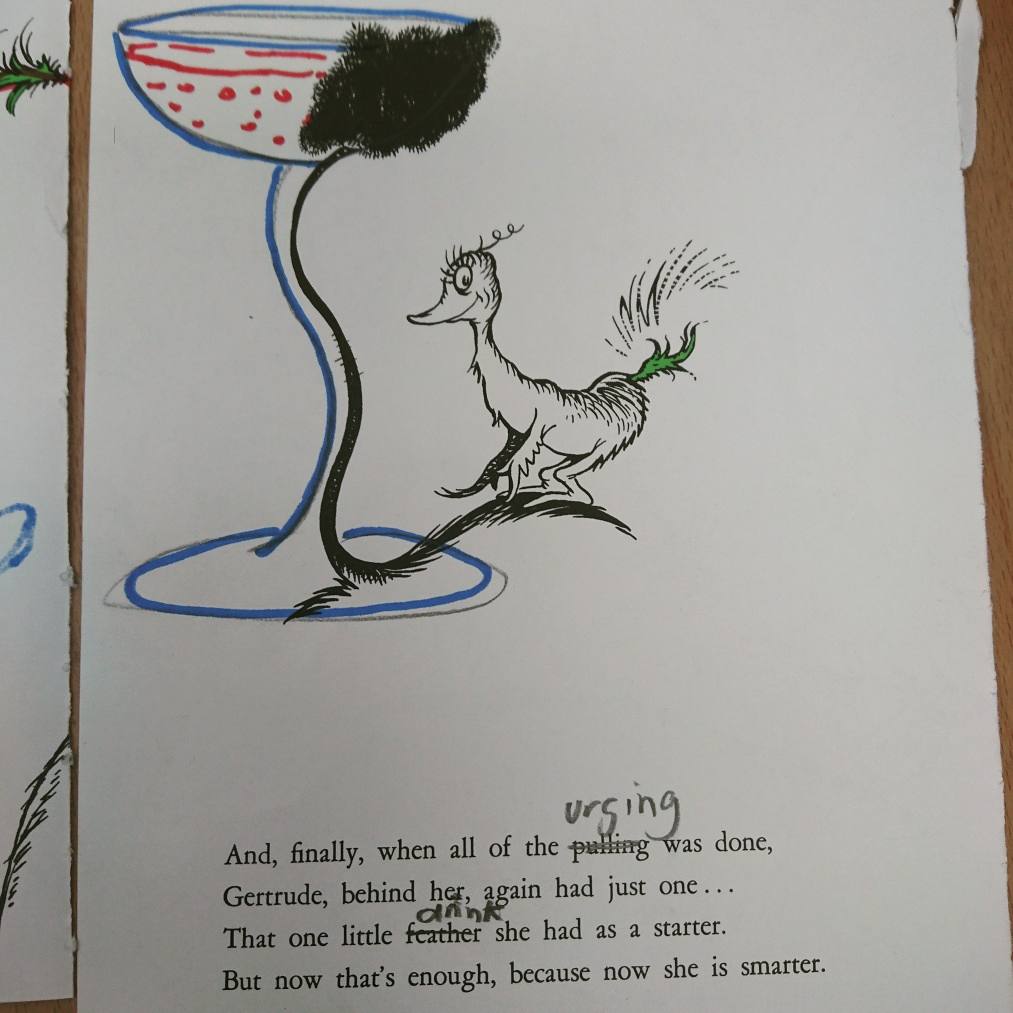
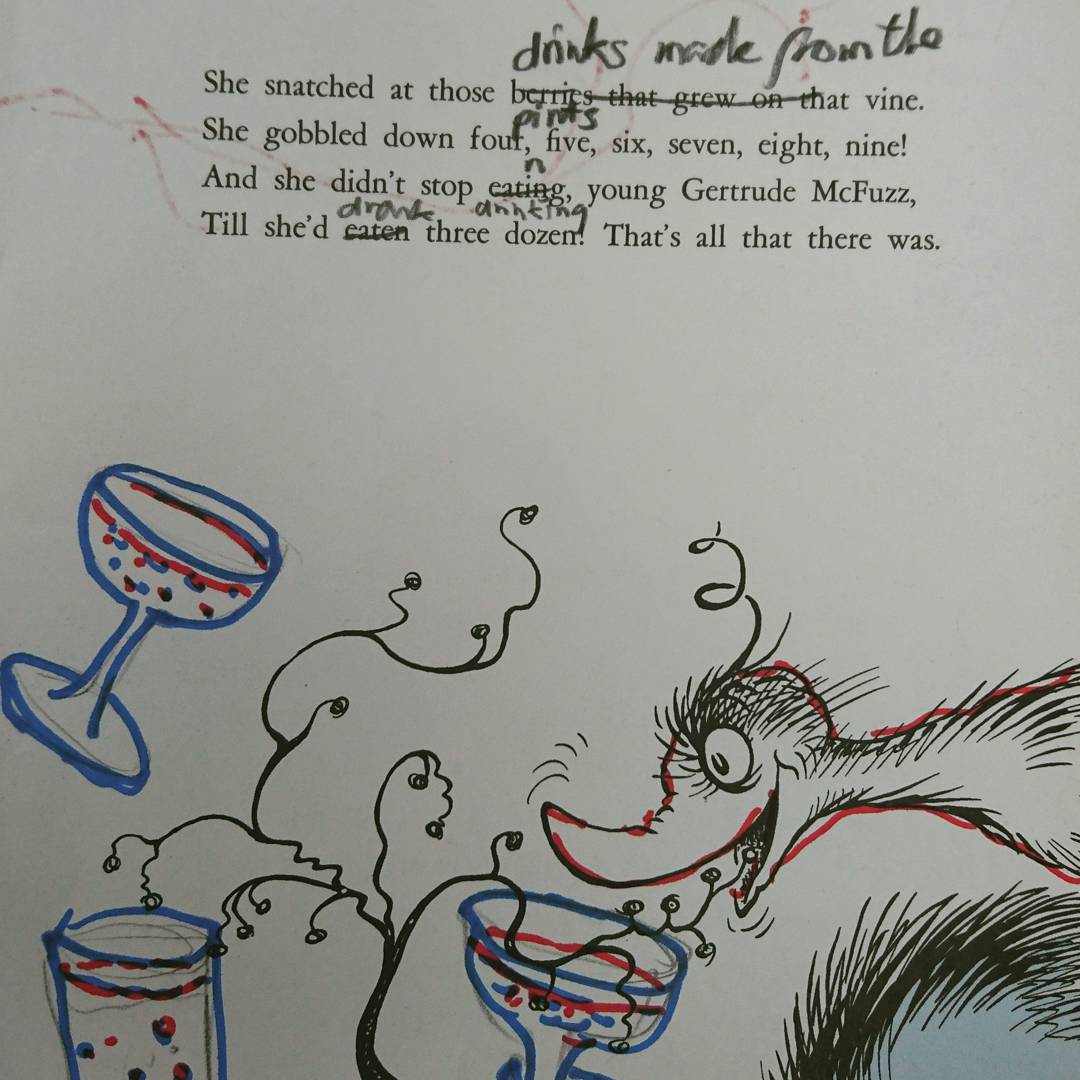
As a group we discussed how methods such as this might bring different kinds of data than can be achieved through more traditional research methods such as interviews.
Further Reading
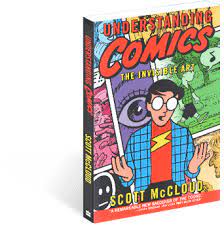
McCloud, S. (2001) Understanding Comics: the invisible art. William Marrow Paperbacks.
Analysing and Disseminating Data Using Comics
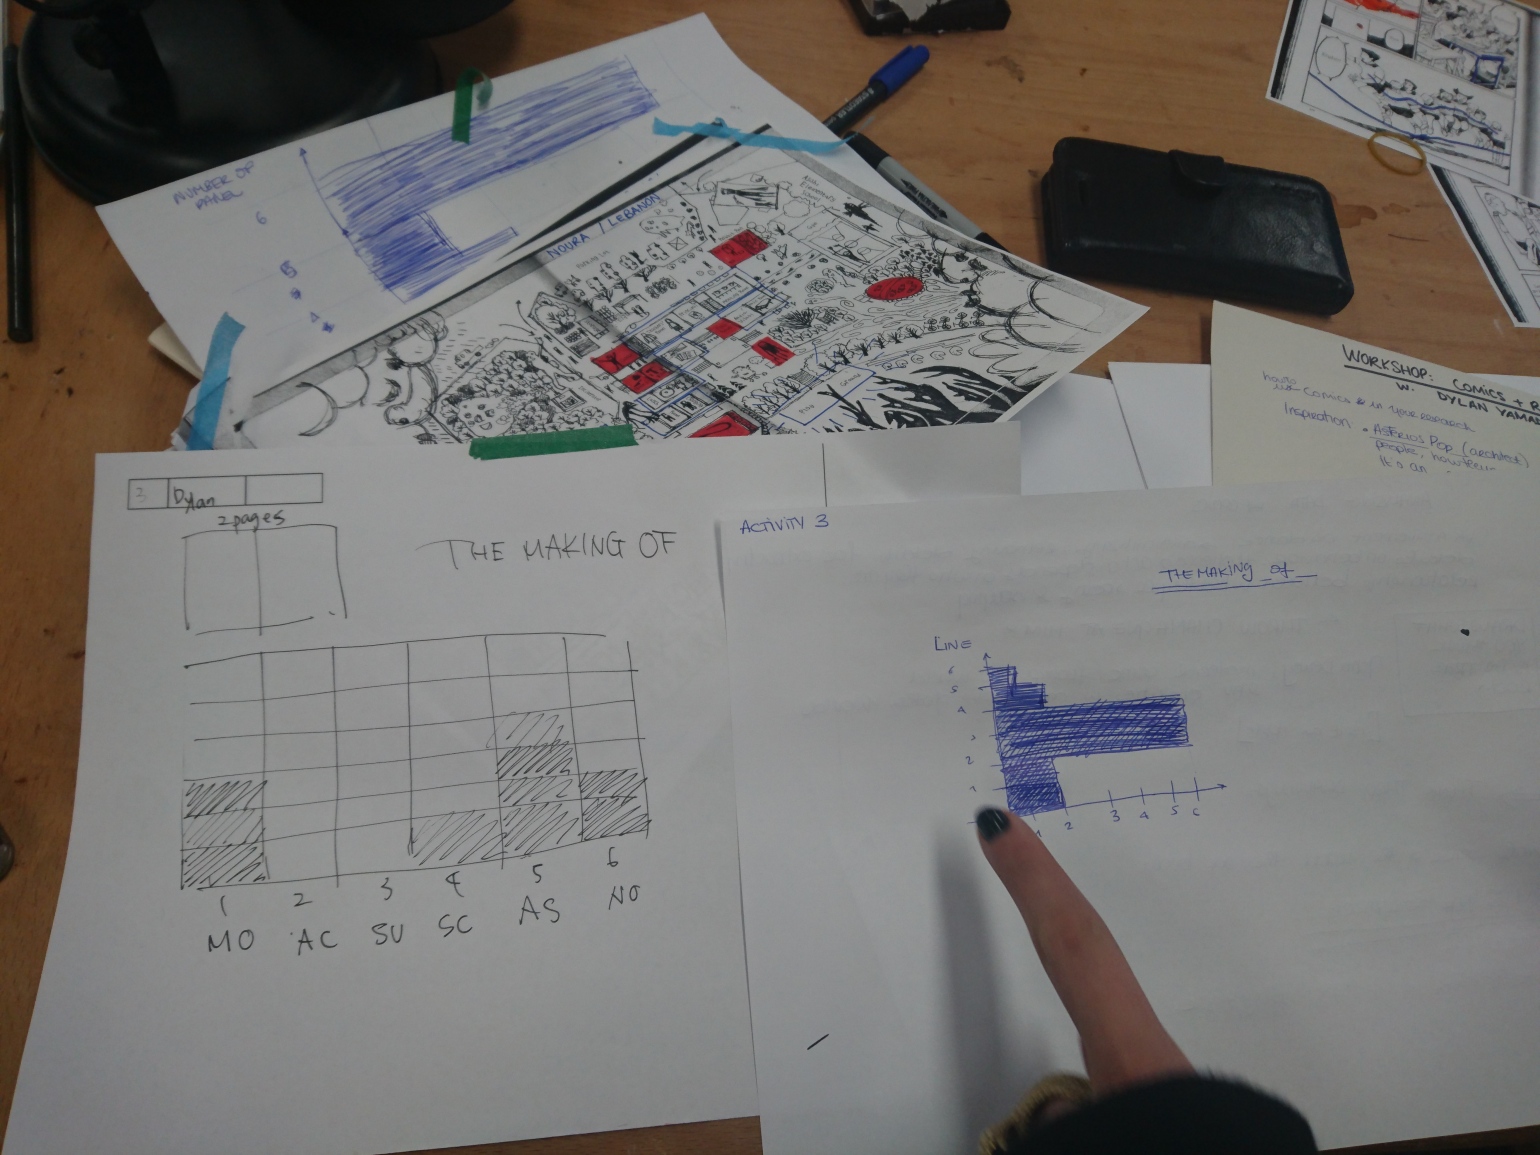
The workshop began by asking students to apply Scott McCloud’s categories, of how a comic narrative moves from frame to frame, in order to analyse pages from two comics; ‘The Making Of’ and ‘Unflattening’. These categories are: Moment-to-Moment; Action-to-Action; Subject-to-Subject; Scene-to-Scene; Aspect-to-Aspect; Non-Sequitur- which offers no obvious logical relationship between the panels. McCloud gives examples of what this looks like in his following illustration:
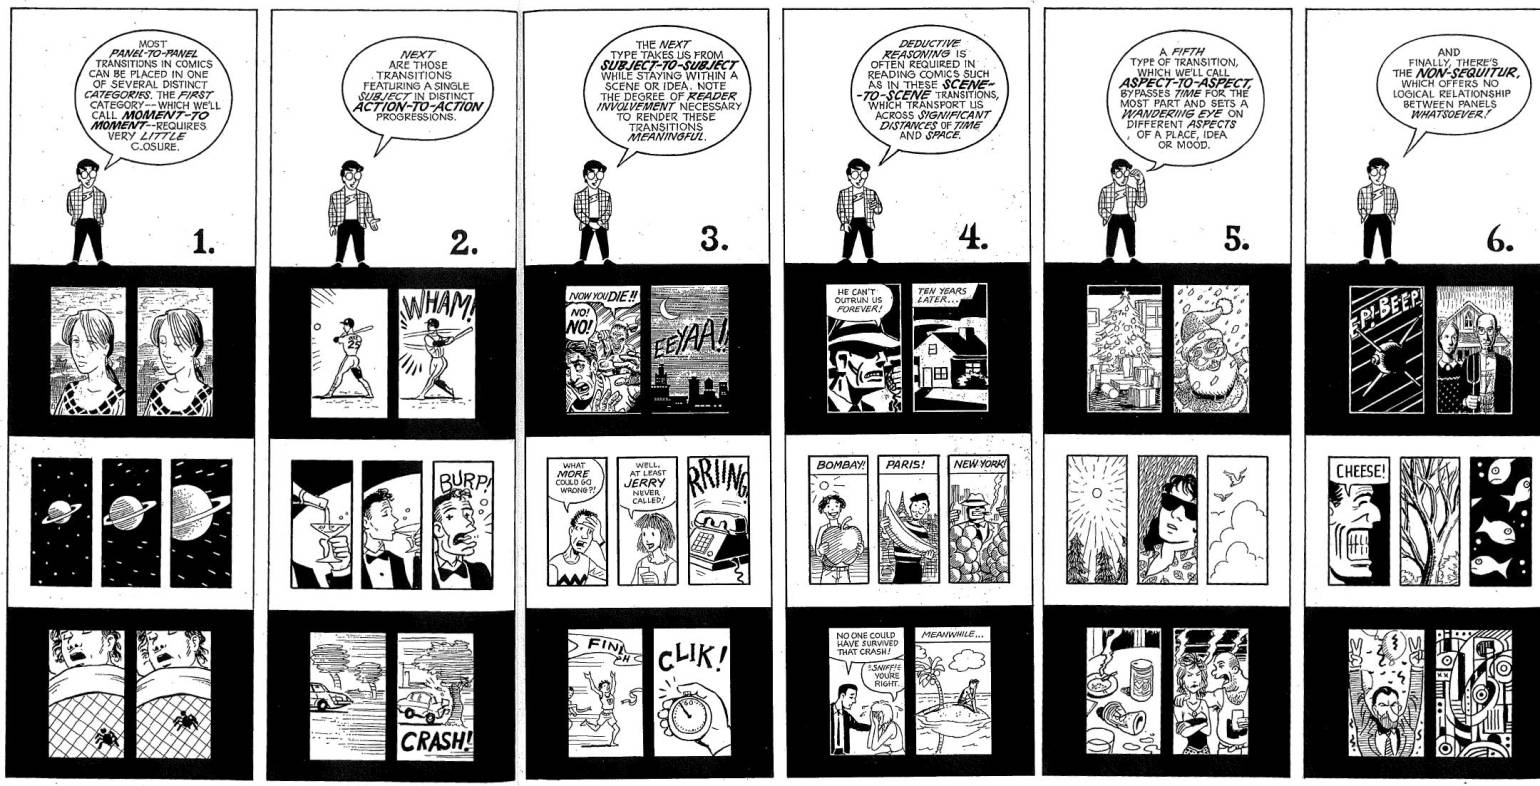 Image: Scott McCloud’s categories for analysing comics
We used these categories to create a bar graph of how many times the shift between panels in the above two graphic novels moved across each category.
We were then able to use this analysis to consider how the narrative might change if we were to illustrate it using only one of Scott McCloud’s categories. In the following example one page from Sousanis’ book Unflattening is changed to tell the narrative only using panel changes that move from Aspect-to-Aspect. Also to consider what happens to the narrative when a different aesthetic style is used.
Following this, I showed how I had used ideas from graphic narratives to inform my own data analysis. Such as in the following image where drawing was used to consider children’s movement within VR:
A fuller discussion of these methods can be found in a Medium post I published here.
In the section on comics for research dissemination, we started by exploring the pros and cons of conveying the pros and cons of medical information via superhero graphics to children.

Next, students were asked to critique how the visual style of a range of comics related or not to the information they were conveying.


Sensory Ethnography
This workshop started by considering how an ethnographic approach can be used to collect first-hand data that can in turn to be used to inform Information Experience Design work. It then went on to introduce two academics that have shown how the study of seemingly everyday things can be used to provide a deep understanding of the world around us. These were Sarah Pink’s work on Sensory Ethnography andTim Ingold’s study of lines.
Sensory ethnography can be used:
- Alone to understand how we account for other people’s experiences through focusing on our senses.
- Combined with other new materialism/ post human theories to de-centre the human and focus on the importance of other living elements/ materials.
” … developing a precise way to analyze how the human is both distinct from and continuous with that which goes beyond it is both crucial and timely” (Kohn, 2013, p. 9)
How do I conduct Sensory Ethnography?
By applying ethnographic methods to sensory perception. Traditionally these are interviews, observations, photography and video. More recently sensory ethnographic methods include using digital and experimental ways to go beyond these traditional methods by using means developed from, art and design practices, such as making, Sound recordings, smell mapping and performance. Some of these are discussed in more detail below.
Why are innovative research methods needed?
Innovative methods for recording sensory experience are needed because traditional means are related more heavily to some senses than others. For example, the rough table below shows how we have developed multiple means for recording and communicating information related to vision but a lot less for smell and taste. Yet we know that humans are sensory beings and that there is a need to pay attention to things that cannot be expressed in words.
McLuhan’s work on sensory ratios state that any new medium alters the existing sense ratios and proportions. In other words media changes the way we perceive the world and information through a rebalancing of different senses. See also the work of Kress (2010) on Multimodality in relation to this.
David Howes writes of the hierarchy of senses and that this differs across cultures. In my work looking at children’s understanding of semiotics in Japan the context was chosen for its developed sense of the visual.
Senses & Technology
Sarah Pink also suggests that there is an increasing need to think about what new forms of data mean in relation to the senses, For example, what does all the data collected by exercise/health tracking apps really mean to the sensory experiences of the people using them? In relation to this there are a number of video on YouTube of people hacking data, such as putting fit bits into a tumble dryer to make it look like they have exercised more. This is also in part driven by the link between health insurance premiums and the tech too.
Three examples are given next of different individuals who are creating and moving forward innovative methods for understanding the senses in relation to particular research topics.
Example 1- embodied research methods- Sol Lennox
Traditional ethnographic methods involve the researcher undertaking the daily activities of their research participants, alongside them, in order to understand their practices. Performing sensory activities together with research participants is a development of this work. Sol Lennox’s work on boxing (see above) also sought to understand how reenacting these sensory experiences can also be used as a form of data analysis and representation of the data. In his PhD study on boxing he found that writing up the data left out one of the key findings which related to the importance of sweat to those that boxed. Thus he choose to undertake his viva while simultaneously warming up for a boxing match to materialise for the examiners this missing element.
In another workshop I have shown how he has also used performance as a means of data analysis. These can be found under the section on Performance Ethnography above.
Example 2- Smell mapping- Kate McLean
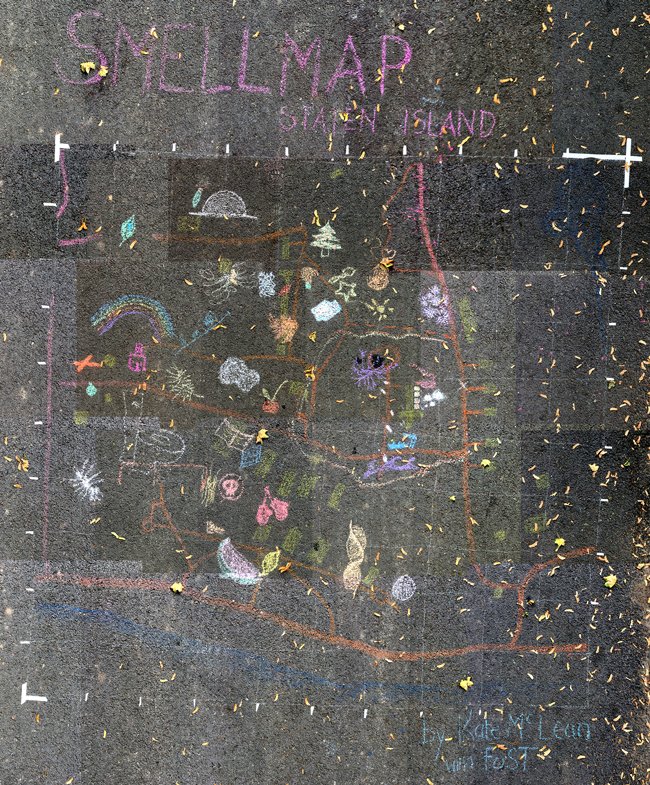
Image by Kate McLean
Smells form part of our knowing, but are elusive, often disappearing before they can be described pinned down. Smell perception is an invisible and currently under-presented dataset with strong connections to emotions and memory. I am part of a small but growing number of innovative practitioners committed to the study and capture of this highly nuanced sensory field.
The tools of my trade include: individual group smellwalks, individual smellwalks (the “smellfie”), smell sketching, collaborative smellwalks, graphic design, motion graphics, smell generation and smell diffusion, all united by mapmaking.” (Extract from Kate McLean’s website)
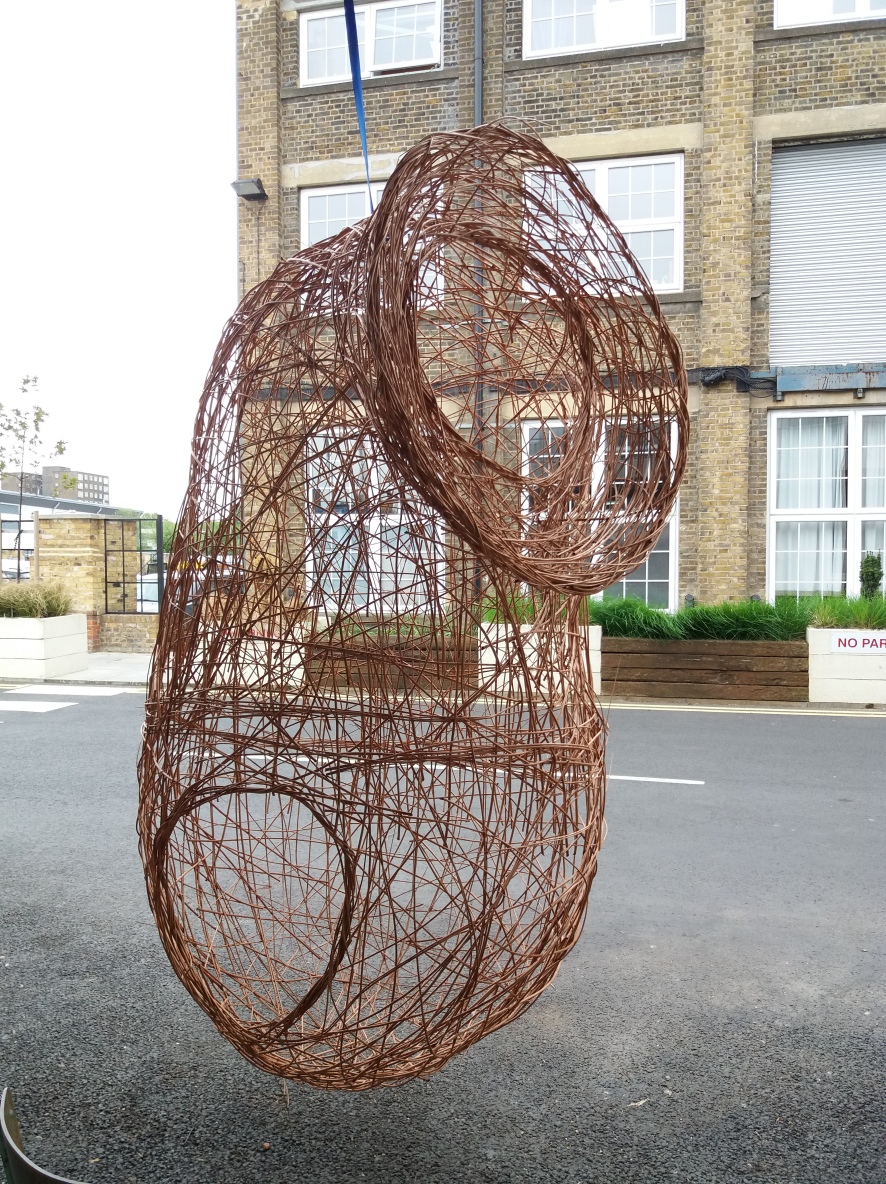
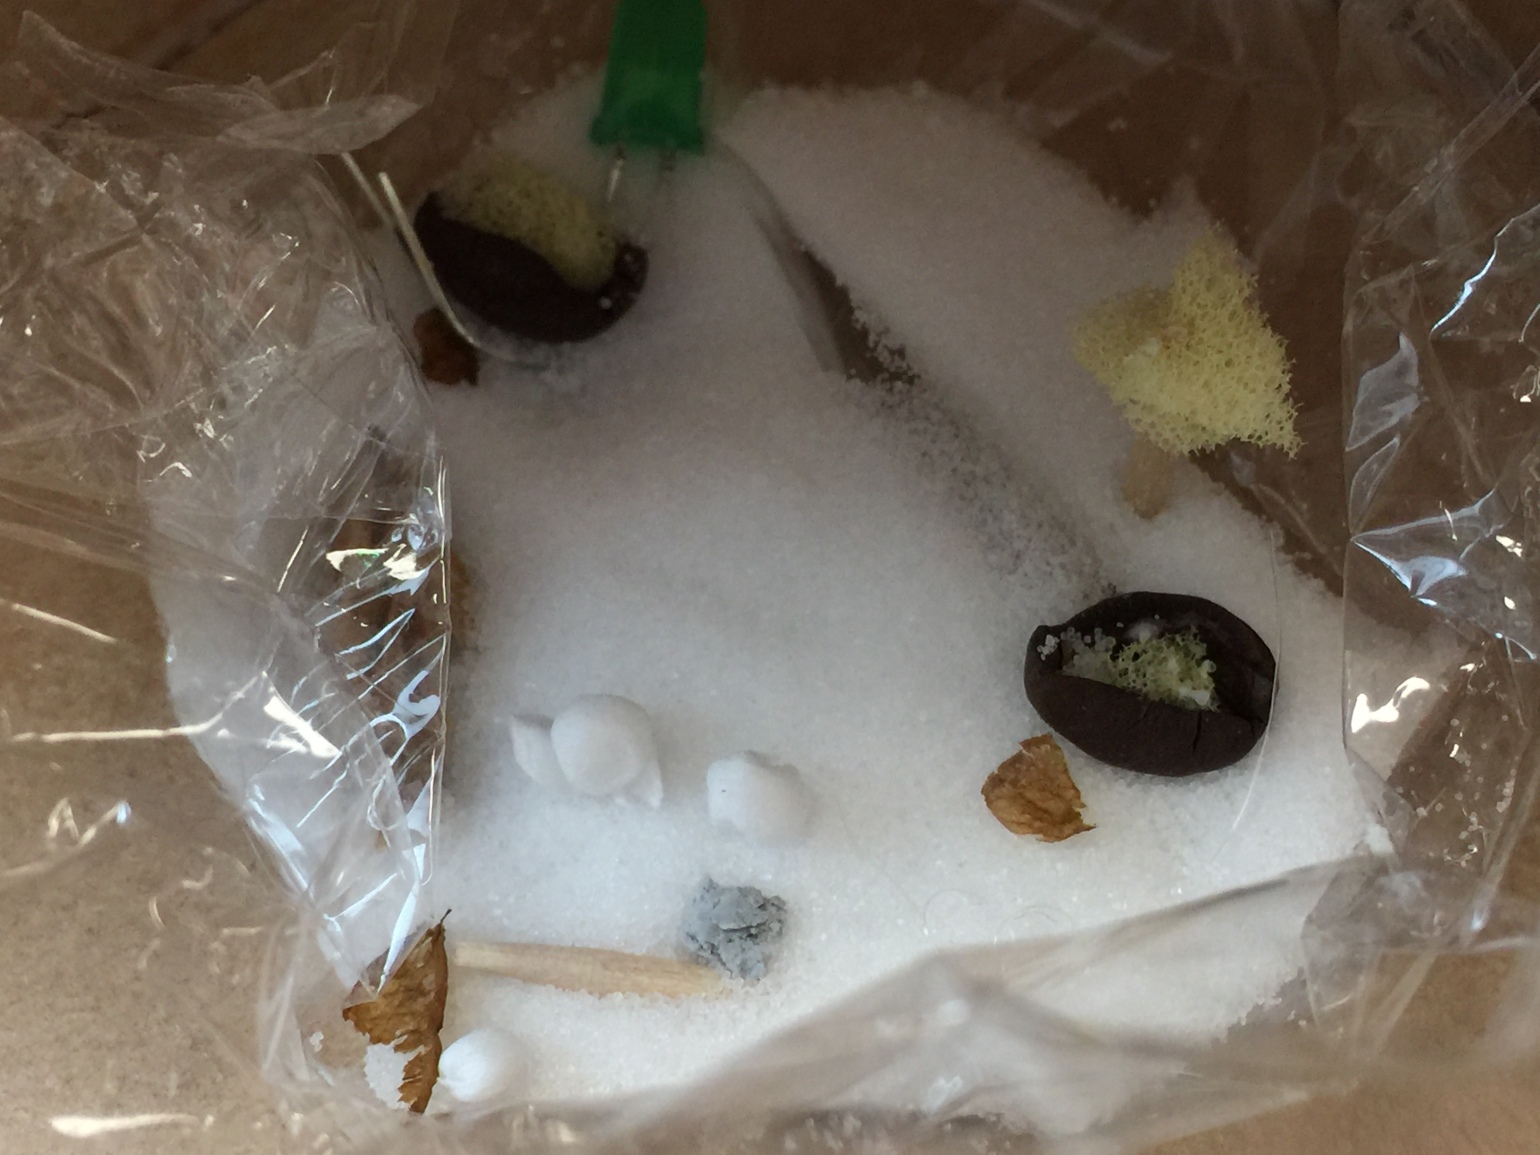
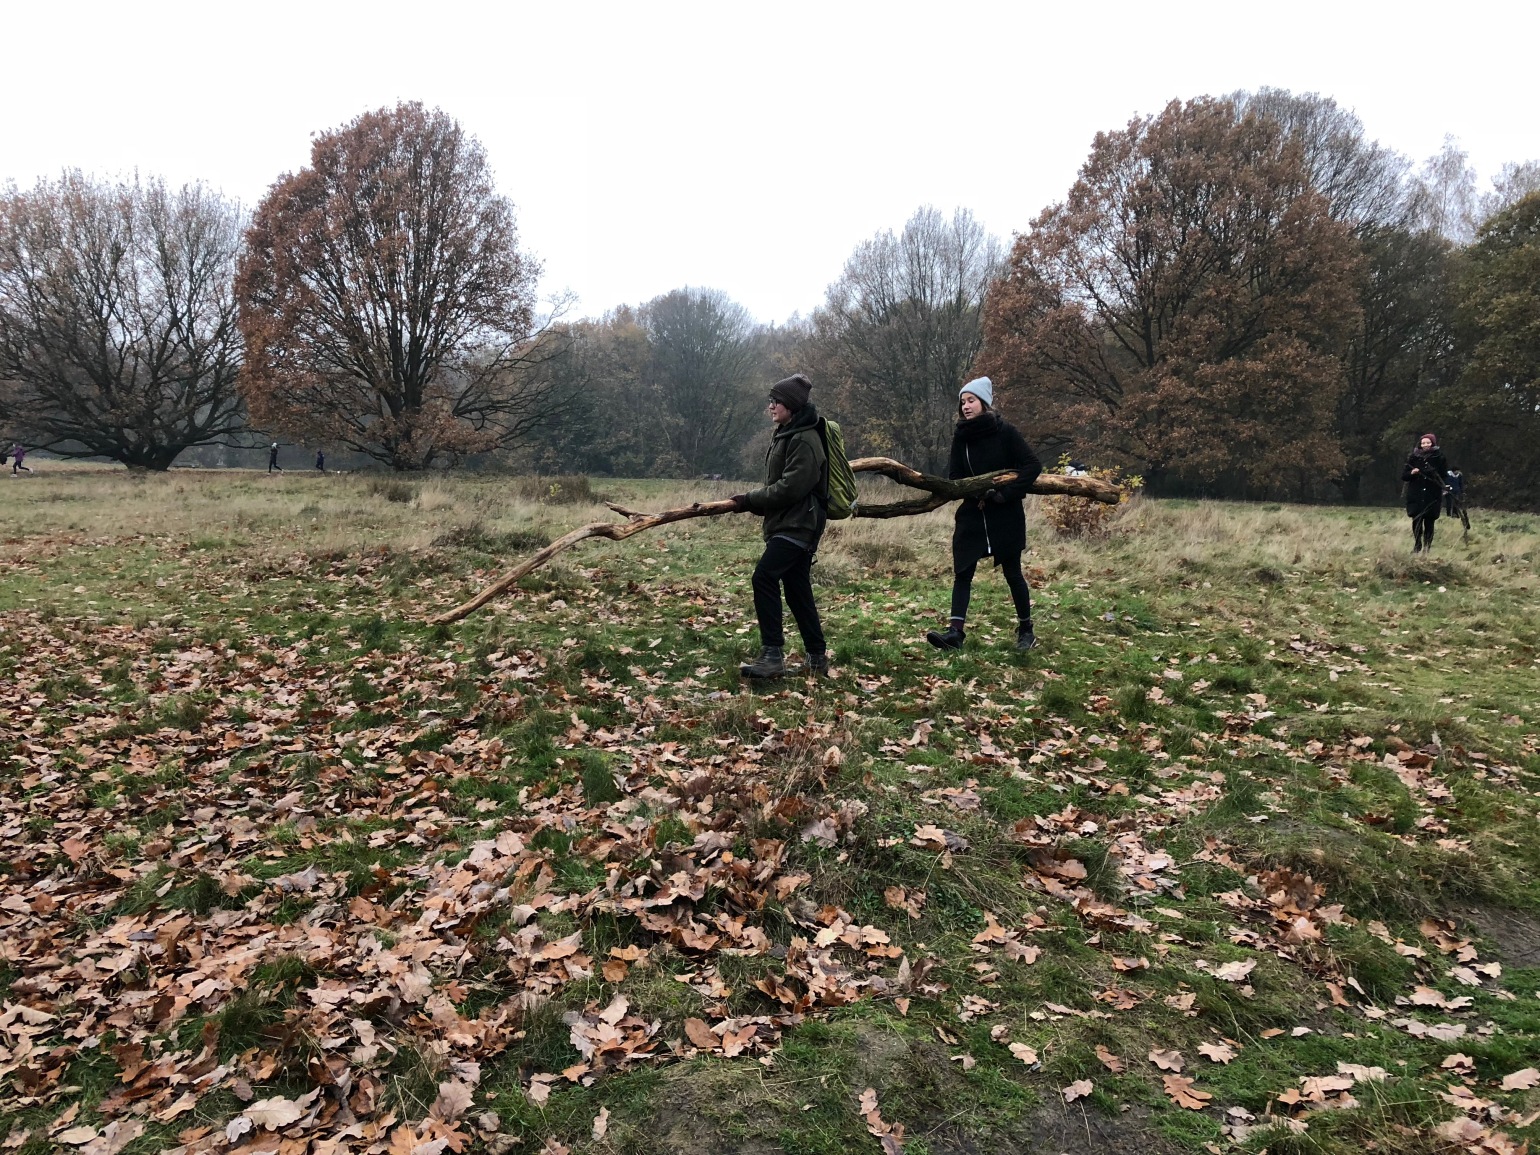
Daisy Buckle was a final year IED student who has been exploring the connection between natural materials and mental well being. Daisy began by exploring materials that can be carried to bring calm. Her work is heavily connected to that of Paula Rautio (2013) who explores how children are drawn to found materials and often collect them and place them in their pockets without thinking. The three examples given above taken from the work of Sol Lennox, Kate McLean and Daisy Buckle could be used as starting points for initiating ideas for how to begin this process, i.e. how can you map the smell of building a den? What are the key movements of den building that would need to be performed in order to understand the experience?
Practical: the brief for the workshop was to build a den that could keep out the cold. To do this groups were asked to divide into Den Builders and Sensory Ethnographers. The role of the Sensory Ethnographers was to find a means of recording the experience of Den Building by focussing on one particular mode. This idea was developed from the work of IED student Daisy Buckle who is exploring how building human sized nests might help with people’s mental and emotional well-being.
Further Reading
Kohn, E. (2013) How Forests Think: Toward an Anthropology beyond the Human. University of California Press
Pink, S. Sensory Ethnography in a Digital-Material World.
Participatory Design
This workshop considered how IED students’ skills as artists and designers could be used to co-produce data with key stakeholders in innovative ways and how this research can inform their Information Experience Design work.
It started by providing examples of how two researcher (myself and Caroline Claisse) have used a range of materials and means to involve different key stakeholders into our independent studies. This includes drawing, making boardgames, altering children’s books, as well as character design and storyboarding. In using these methods we have drawn on ideas from Participatory Design and Co-production.
The workshop started by asking first year students to focus on their dissertation topic and second years on the core topic of their final piece. With this in mind both cohorts of students were asked to identify all the different people who might be interested or connected to their chosen topic.
Designing videogames for hospitalised children
As an illustration of this I introduced an AHRC- funded network project I undertook in 2014 to design a videogame for hospitalised children. The key interested parties in that project were identified as (1) academics with expertise on play and the portrayal of emotion in visual form, (2) representatives from the digital games industry and (3) hospital play specialists. Of course children as end users are also a key party to such a project but gaining ethical approval from the NHS to include them was beyond the scope of this project.
The interests of the three parties were used as the bases for designing an initial series of three workshops to encourage knowledge exchange and develop ideas to lead into the videogame design:

Image: Brainstorm for the initial 3 workshops
play in different contexts, such as in the park, with friends and siblings at home, or in the school playground because of being in hospital.
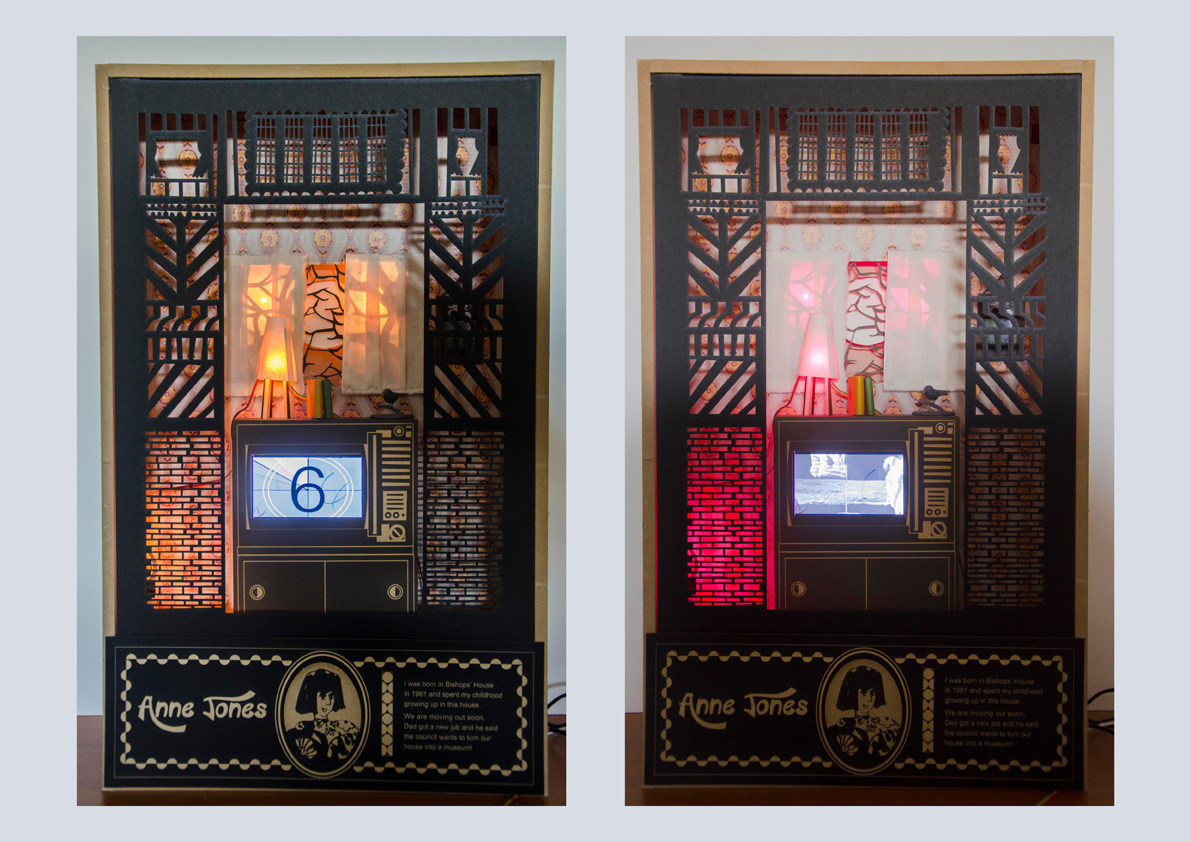
Jo made the piece based on the idea that we might be living in similar looking houses to our neighbours but be unaware of what is happening inside. Further, that we cannot tell whether the occupants are feeling isolated ornot. The hospital play specialists saw similarities between her depiction and children in hospital beds. They described how each bed looks the same but it is not always easy to see at a glance the illnesses children were suffering or how they might be feeling about these.

Image: Art work by Jo Peel
Curious House
The second example shared was the doctoral work of IED graduate Caroline Claisse. Caroline has been undertaking research through design and participatory methods to investigate the potential of tangible interaction and embedded technologies to engage people at personal and emotional levels with heritage. She describes herself as also being “interested in ways of bringing technology in historical sites and in designing situations to engage people in the process of creating novel experiences of heritage”. Further details about her work, including examples of work in progress as well as final pieces made for heritage sites, such as the one below, can be found here.
Practical: IED students were set the following brief:
- Outline the key stakeholders in your work?
- What would you like to know from them to help inform your work?
- How can you use your art and design skills to work with them to find this knowledge out?
- Produce a prototype of one activity from stage 3 to share with the group.
A few of the outputs are as follows (written in the students’ own words).
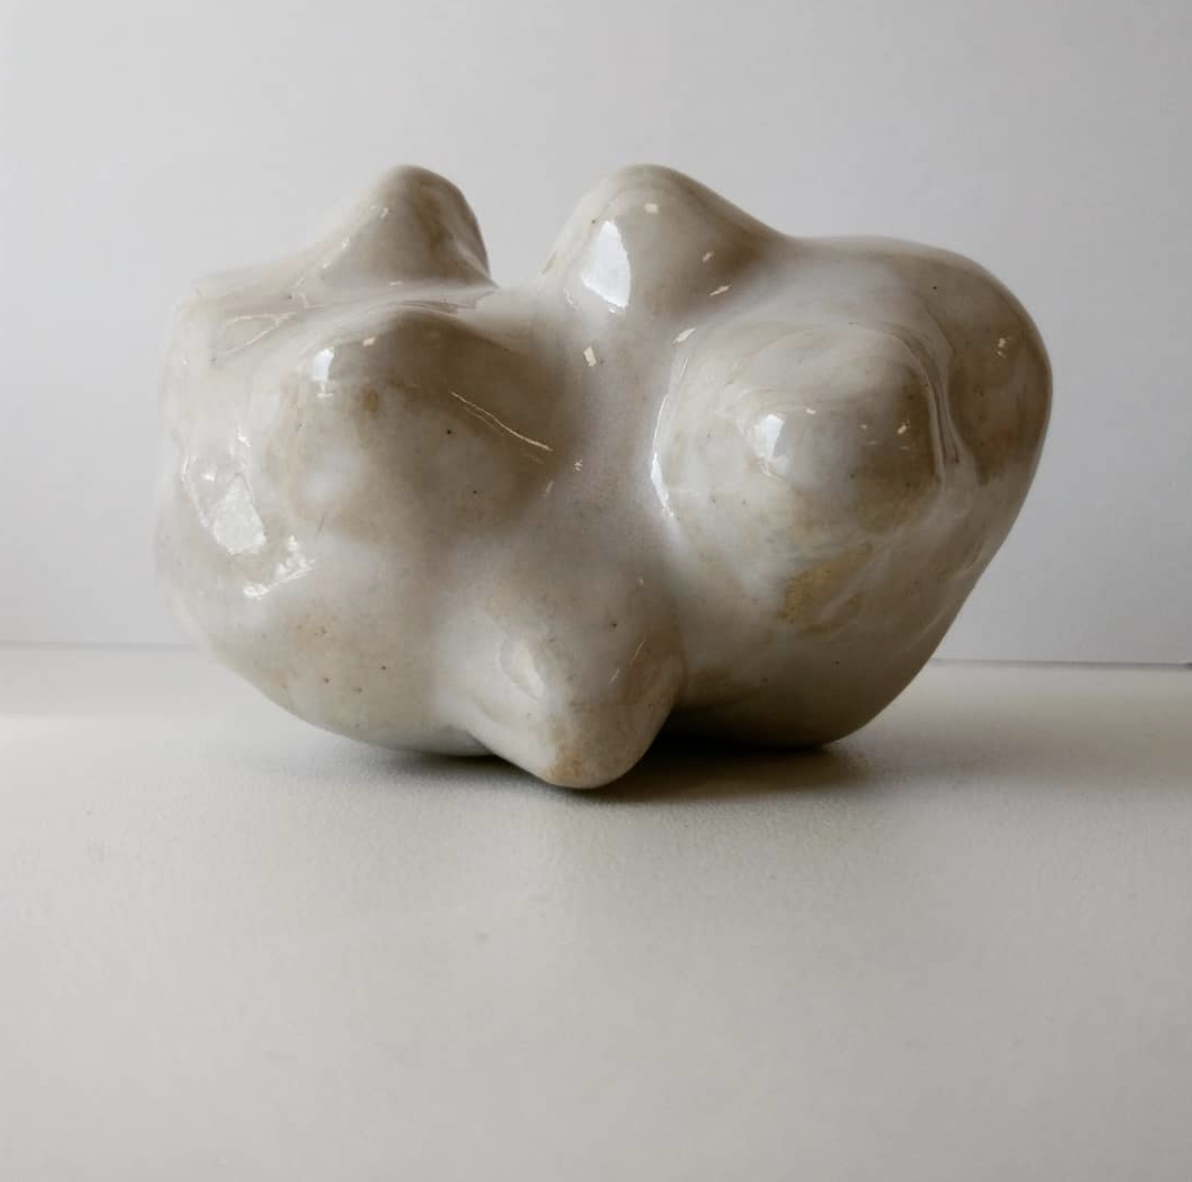
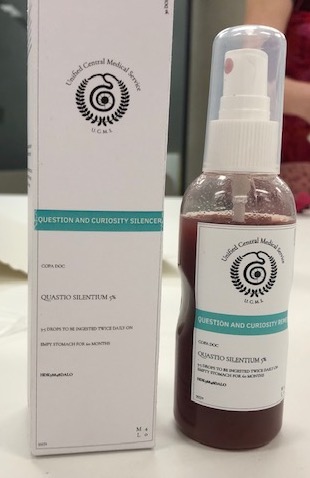
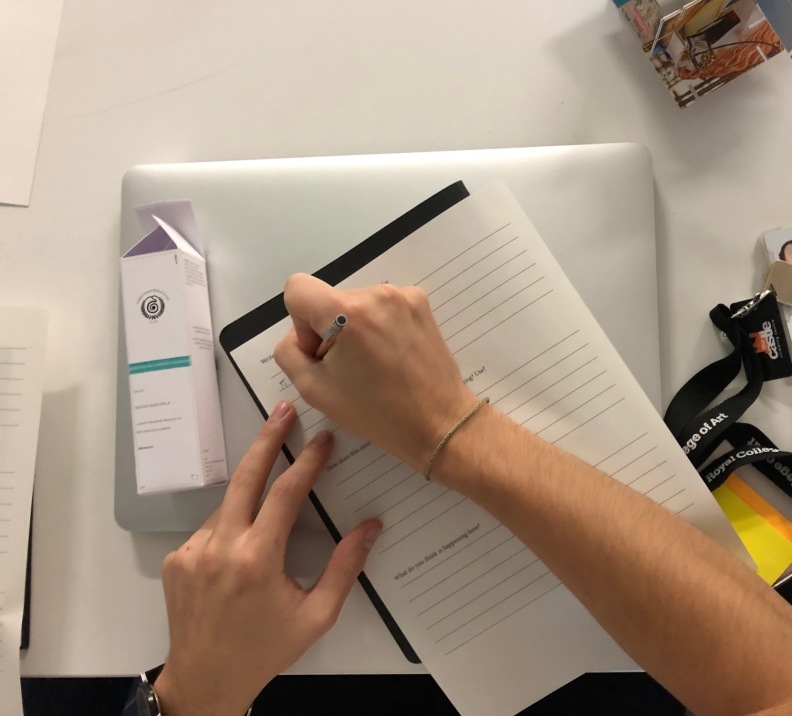
Sci-fi Medicine/ Henri Holz
In the Participatory Design workshop, we decided who the stakeholders were in our projects, what we would like to know from them and how we would use art and design methods to do this. For my project there were no clear stakeholders, instead I decided to gather research that would help me understand how my practical work was understood when there is no explanation with it. Thus in a sense, the audience that views the work, was considered to have a role similar to a stakeholders.
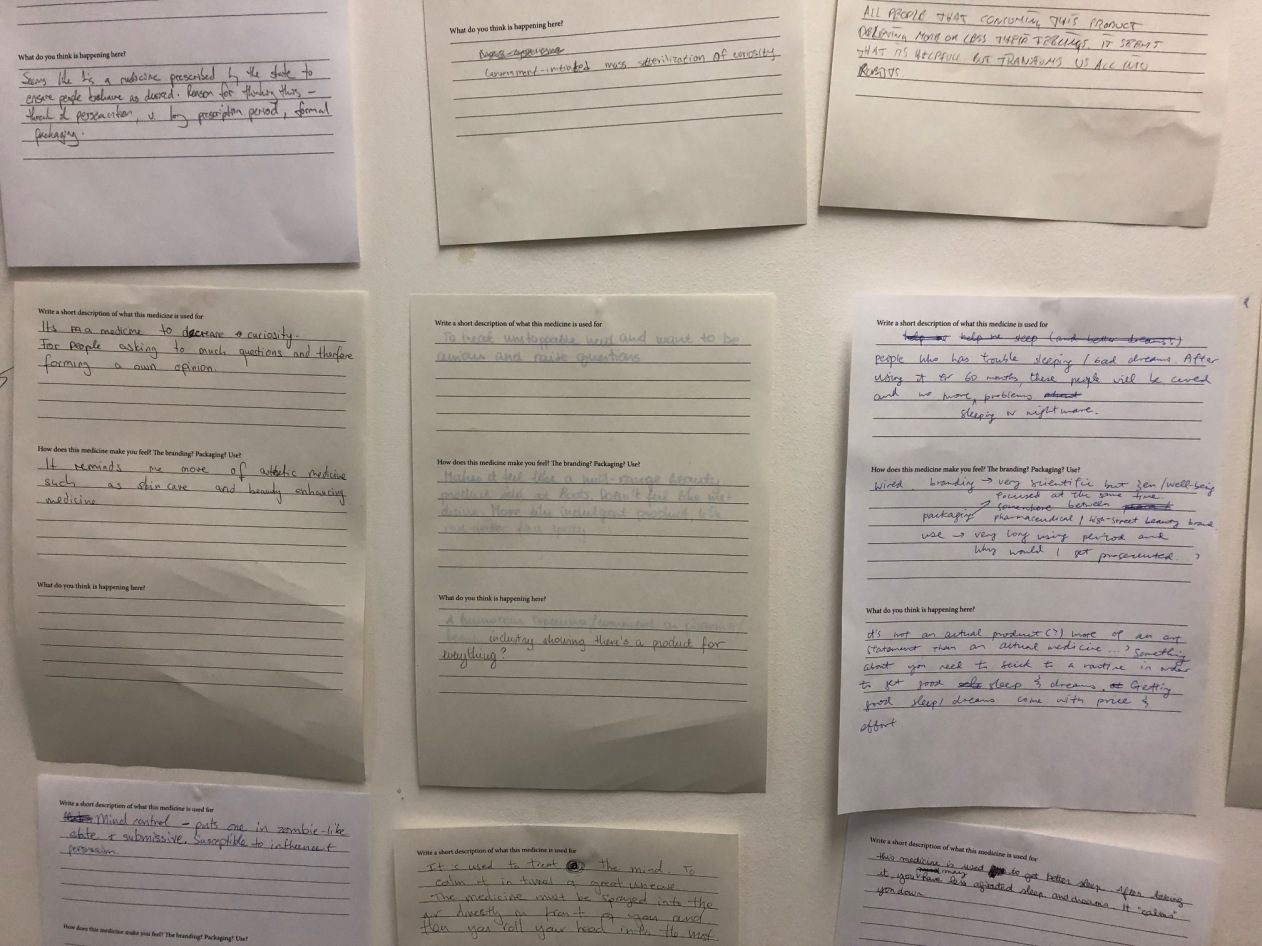
I gave peers two of the props from my future/alternate world and asked them to each write one or two sentences describing the medicine. Reading over the responses allows me to better understand where the design can be developed to create a clearer narrative and add the depth needed to make a believable world.
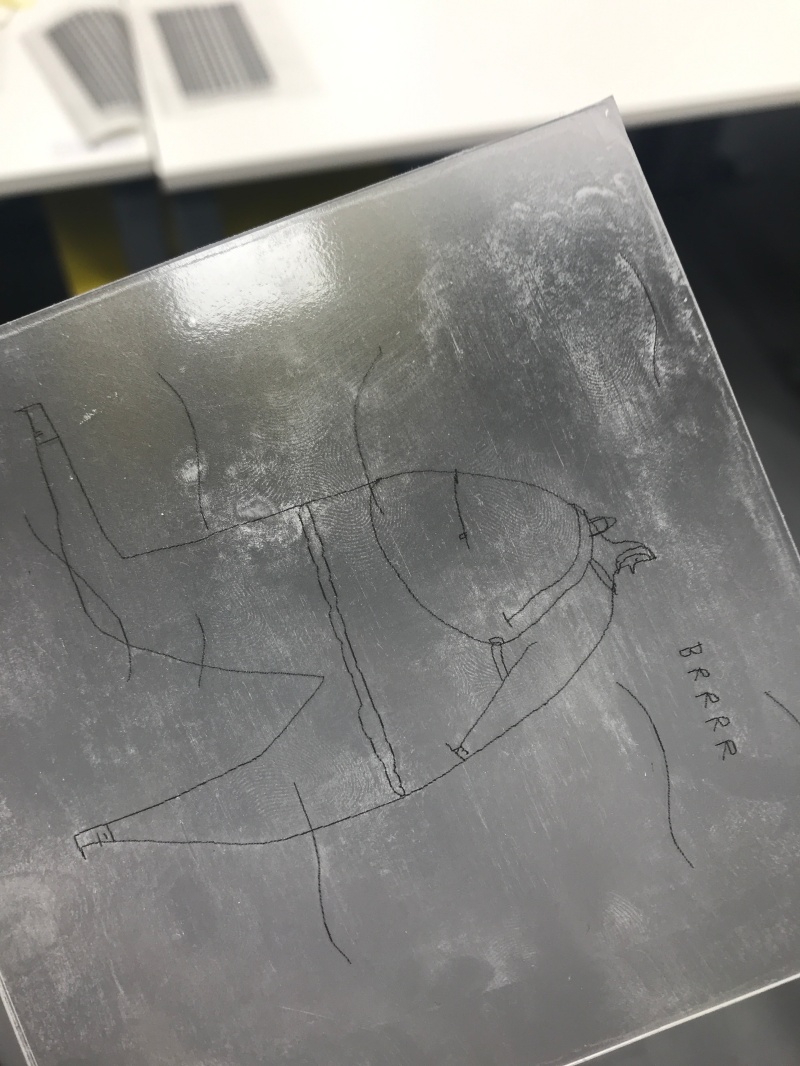
Children Interacting with Museum Exhibits/ Akvilė Terminaite
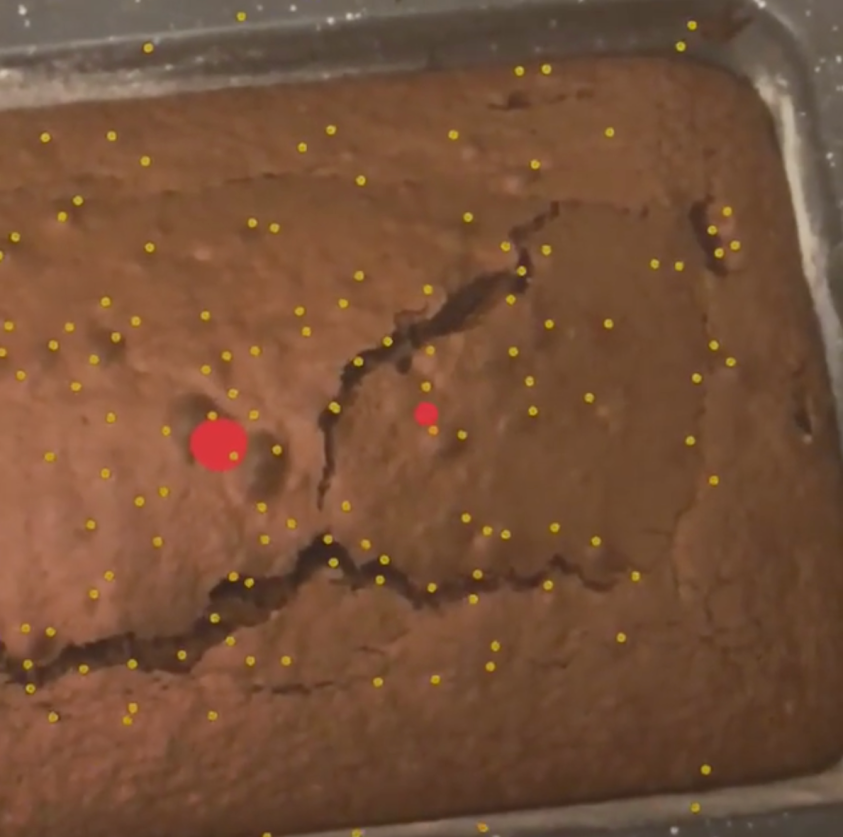
During the workshop I started thinking about the stakeholders in my dissertation and how they could help inform my research. My interest lies in interactive learning galleries in museums and how they provide learning experiences for children.
Thinking about interactive objects in these galleries I wondered if there is a way to provide some evidence to their popularity in a visual way. During the workshop I investigated if I could register people’s fingerprints by passing around perspex plates with different drawings and later coating them with a light layer of baking powder. As the fingerprints showed up I could see which of the three plates participants interacted with the most, allowing me to make an assumption on their popularity.
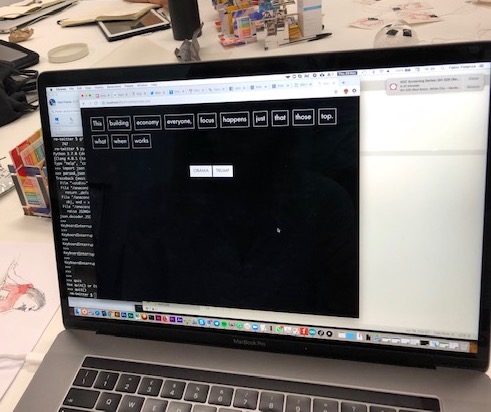
The Power of Words/ Fabio Fidanza
As part of my research on political language, influence and persuasion I created a quick prototype during the research methods session to respond to two research questions:
- Is it possible to identify if a tweet was written by Obama or Trump based on the decomposed list of its words, sorted alphabetically?
- Can the activity of identifying a Tweet author be engaging and generate conversation around political language?
Further reading
Yamada-Rice, D. (2017) Play in Dark Times, Contemporary Issues in Early Childhood.
Research with Children
This workshop focused on research for and with children. Children can be great research participants as they often provide insights different from adults. Different methods can be used to work with children. Like adults children also need to be informed of your study and consent sought, but depending on the age of the children you want to work with there are different means of doing this. Using some examples of my own research I will show you how children were included in the studies.
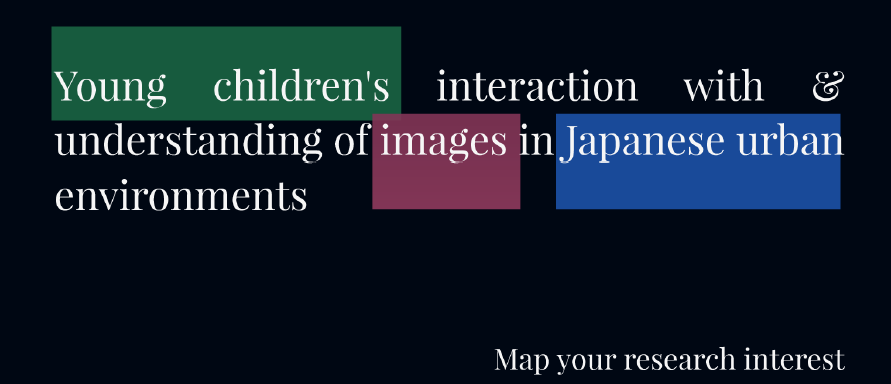
At the start of the session, students were asked to design a way to explain a study about children interaction with and understanding of the visual mode to young children (3-6 years). This related to the theme of my doctoral research which I then went on to describe in relation to the methodology I had designed. Ahead of this students were asked to think about how they might explain the following to young children.
- Why you are doing the study?
- How can you explain what visual mode means?
- What kind of things might you ask children about comprehension?
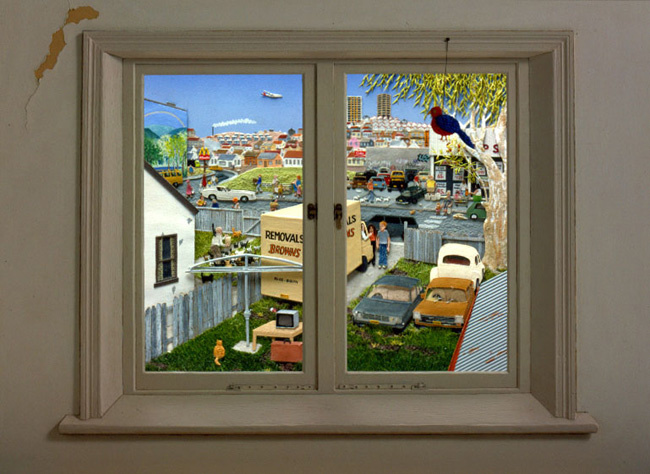
I shared the means I used which included playing a memory game, using a picture book and sharing photographs of the visual mode in my own life. These methods were chosen because they were age-appropriate playful means that children were already familiar with. Each means had a different purpose. For example, the picture book Belonging by Jeannie Baker was used to explain the overall topic of my study. The book is purely pictorial and tells the story of how the view outside a person’s bedroom changes over the course of her life. I told children that as in the story, I was interested in how there are an increasing number of signs in the urban environment as well as images in our daily lives, and that I wanted to know more about which ones they were interested in and what they understood about them.
Workshop participants include many of their own ideas for how they would explain the research topic to children which included designing and playing with their own board game and role-play. Following on from this I shared an example from the doctoral study of Lisa Procter into the Social and Emotional Aspects of Learning (SEAL) part of the UK curriculum to show how even terms such as ‘research’ should be explained to children in a way they can understand:

Following on from this workshop participants were asked to think of ways in which they could get consent from young children and how they could allow them to opt out of their research. Examples were share such as ‘stop’ and ‘go’ cards that children can pass to the researcher to indicate when they are happy or not to be involved in the research study.
Practical: In the final part of the workshop I shared how I had given the young children in my study cameras and asked them to photograph the images that interested them in their lives, this included their home, and public spaces. Following this the workshop participants were set the same task to take photographs of images that interested them between the RCA campus and the nearest Tube station and back. We then focused on how to use Visual Content Analysis as a means of making sense of what had been photographed. Visual Content Analysis can be used to quantify themes defined by the researcher in relation to the number of times they appear across a visual data set.

Students came up with their own categories and sub-categories for analysis which included the following:
1. Modes of representation: writing/ writing & image combined/ image/ other
2. Location of image: commercial/ residential/ other
3. Image medium: illustration/ photography/ architecture/ sculpture/ other
4. Image purpose: signage/ advertising/ graffiti/ entertainment (i.e. TV, book)/ other
5. Temporality: temporary/ permanent/ other
Workshop participants then coded each photograph of a data set as to which subcategory of each of the 5 main categories it fell into. The different data sets (sets of photographs taken by each individual student) were compared to one another.
Students then explored the extent to which their photographs were similar or different to those taken by young children on the same topic. Some of the differences were that the children’s photographs did not always seem to be directly related to the research question. For example, they took lots of photographs of the ground, their feet and family. Also there were a lot of photographs that were blurry or not framed well. As a group we discussed what we would do with photographs such as these in relation to data analysis.
Image: Photograph taken by a 3-year-old
Further Reading
James, A. & Christensen, P. (2017) Research with Children: Perspectives and Practices. London: Routledge.
Rautio P (2013) Children who carry stones in their pockets: On autotelic material practices in everyday life. Children’s Geographies, Vol. 11, No. 4, p. 394–408.
Stirling, E. & Yamada-Rice, D. (eds) (2015) Visual Methods with Children and Young People: Academics and Visual Industries in Dialogue. London: Palgrave.
Theorising the Non-Human
“Things make us just as much as we make things.” (Miller, 2010)
Recently there is a rise in theories for understanding the non-human. This workshop sought to provide insight into some of these, e.g. posthumanism, object ethnograph and new materialism. The workshop started by asking participants to choose a pebble from a selection. Then to reflect upon why they chose this one particular stone rather than others (colour? weight? shape? texture? emotion?)
In the film Departures stones were given as letters. The clip can be seen here.
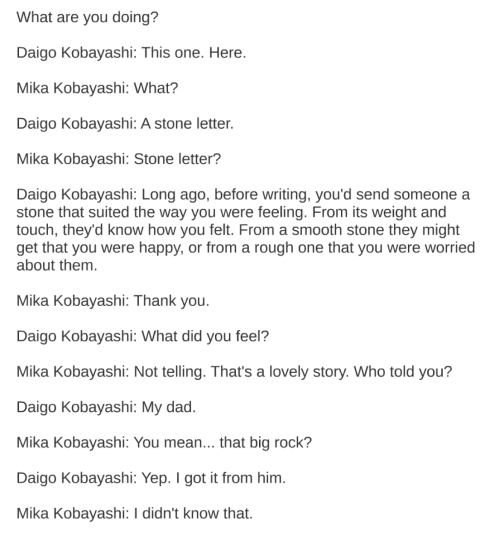
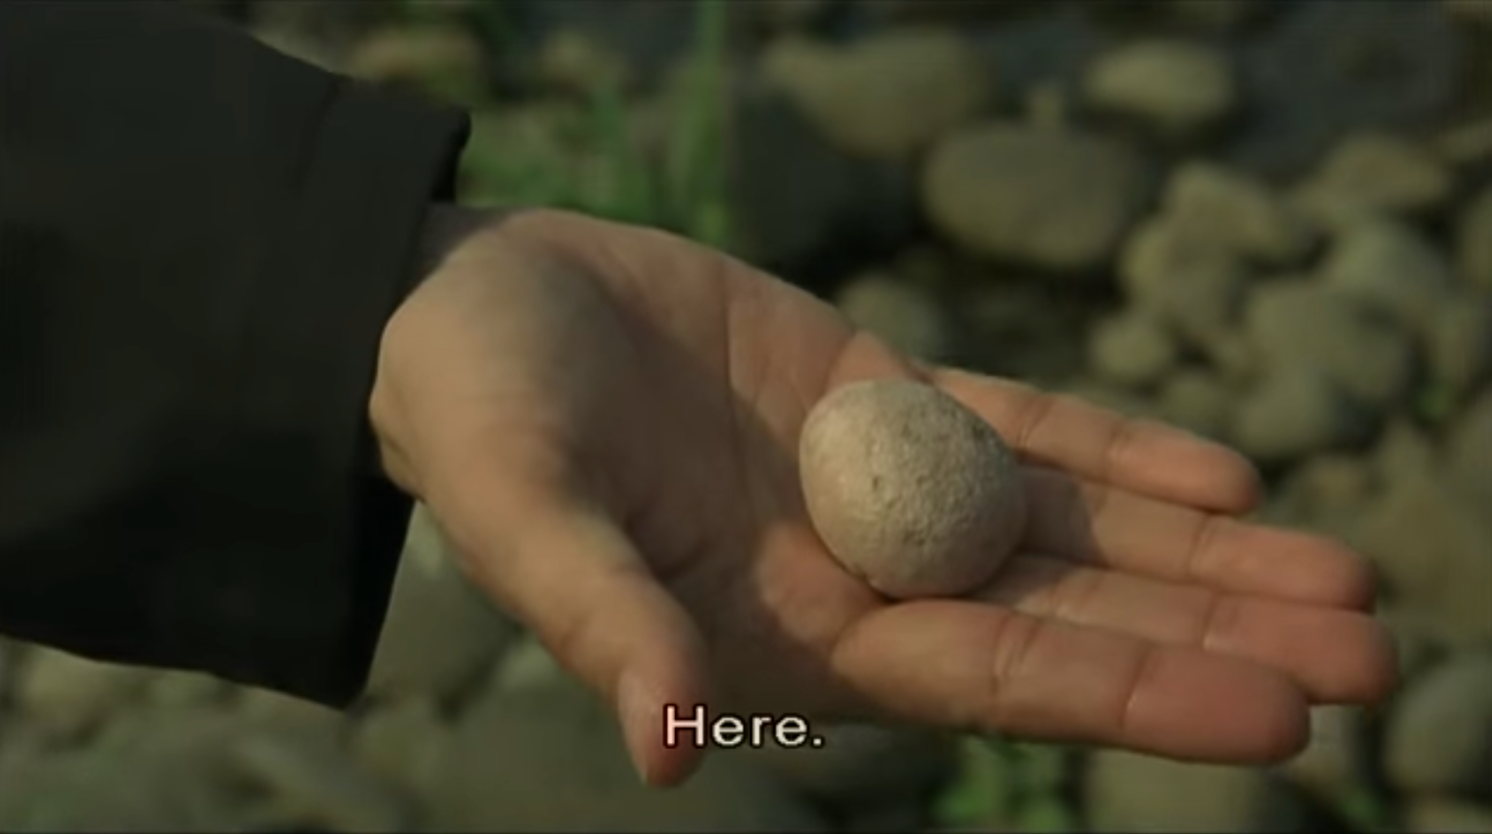
Image: Stone letter, a scene from Yojiro Takita’s Departures

This can be seen in collections often held by young children, that often contain items that might resemble ‘rubbish’ such as stones and bits of foil wrappers:

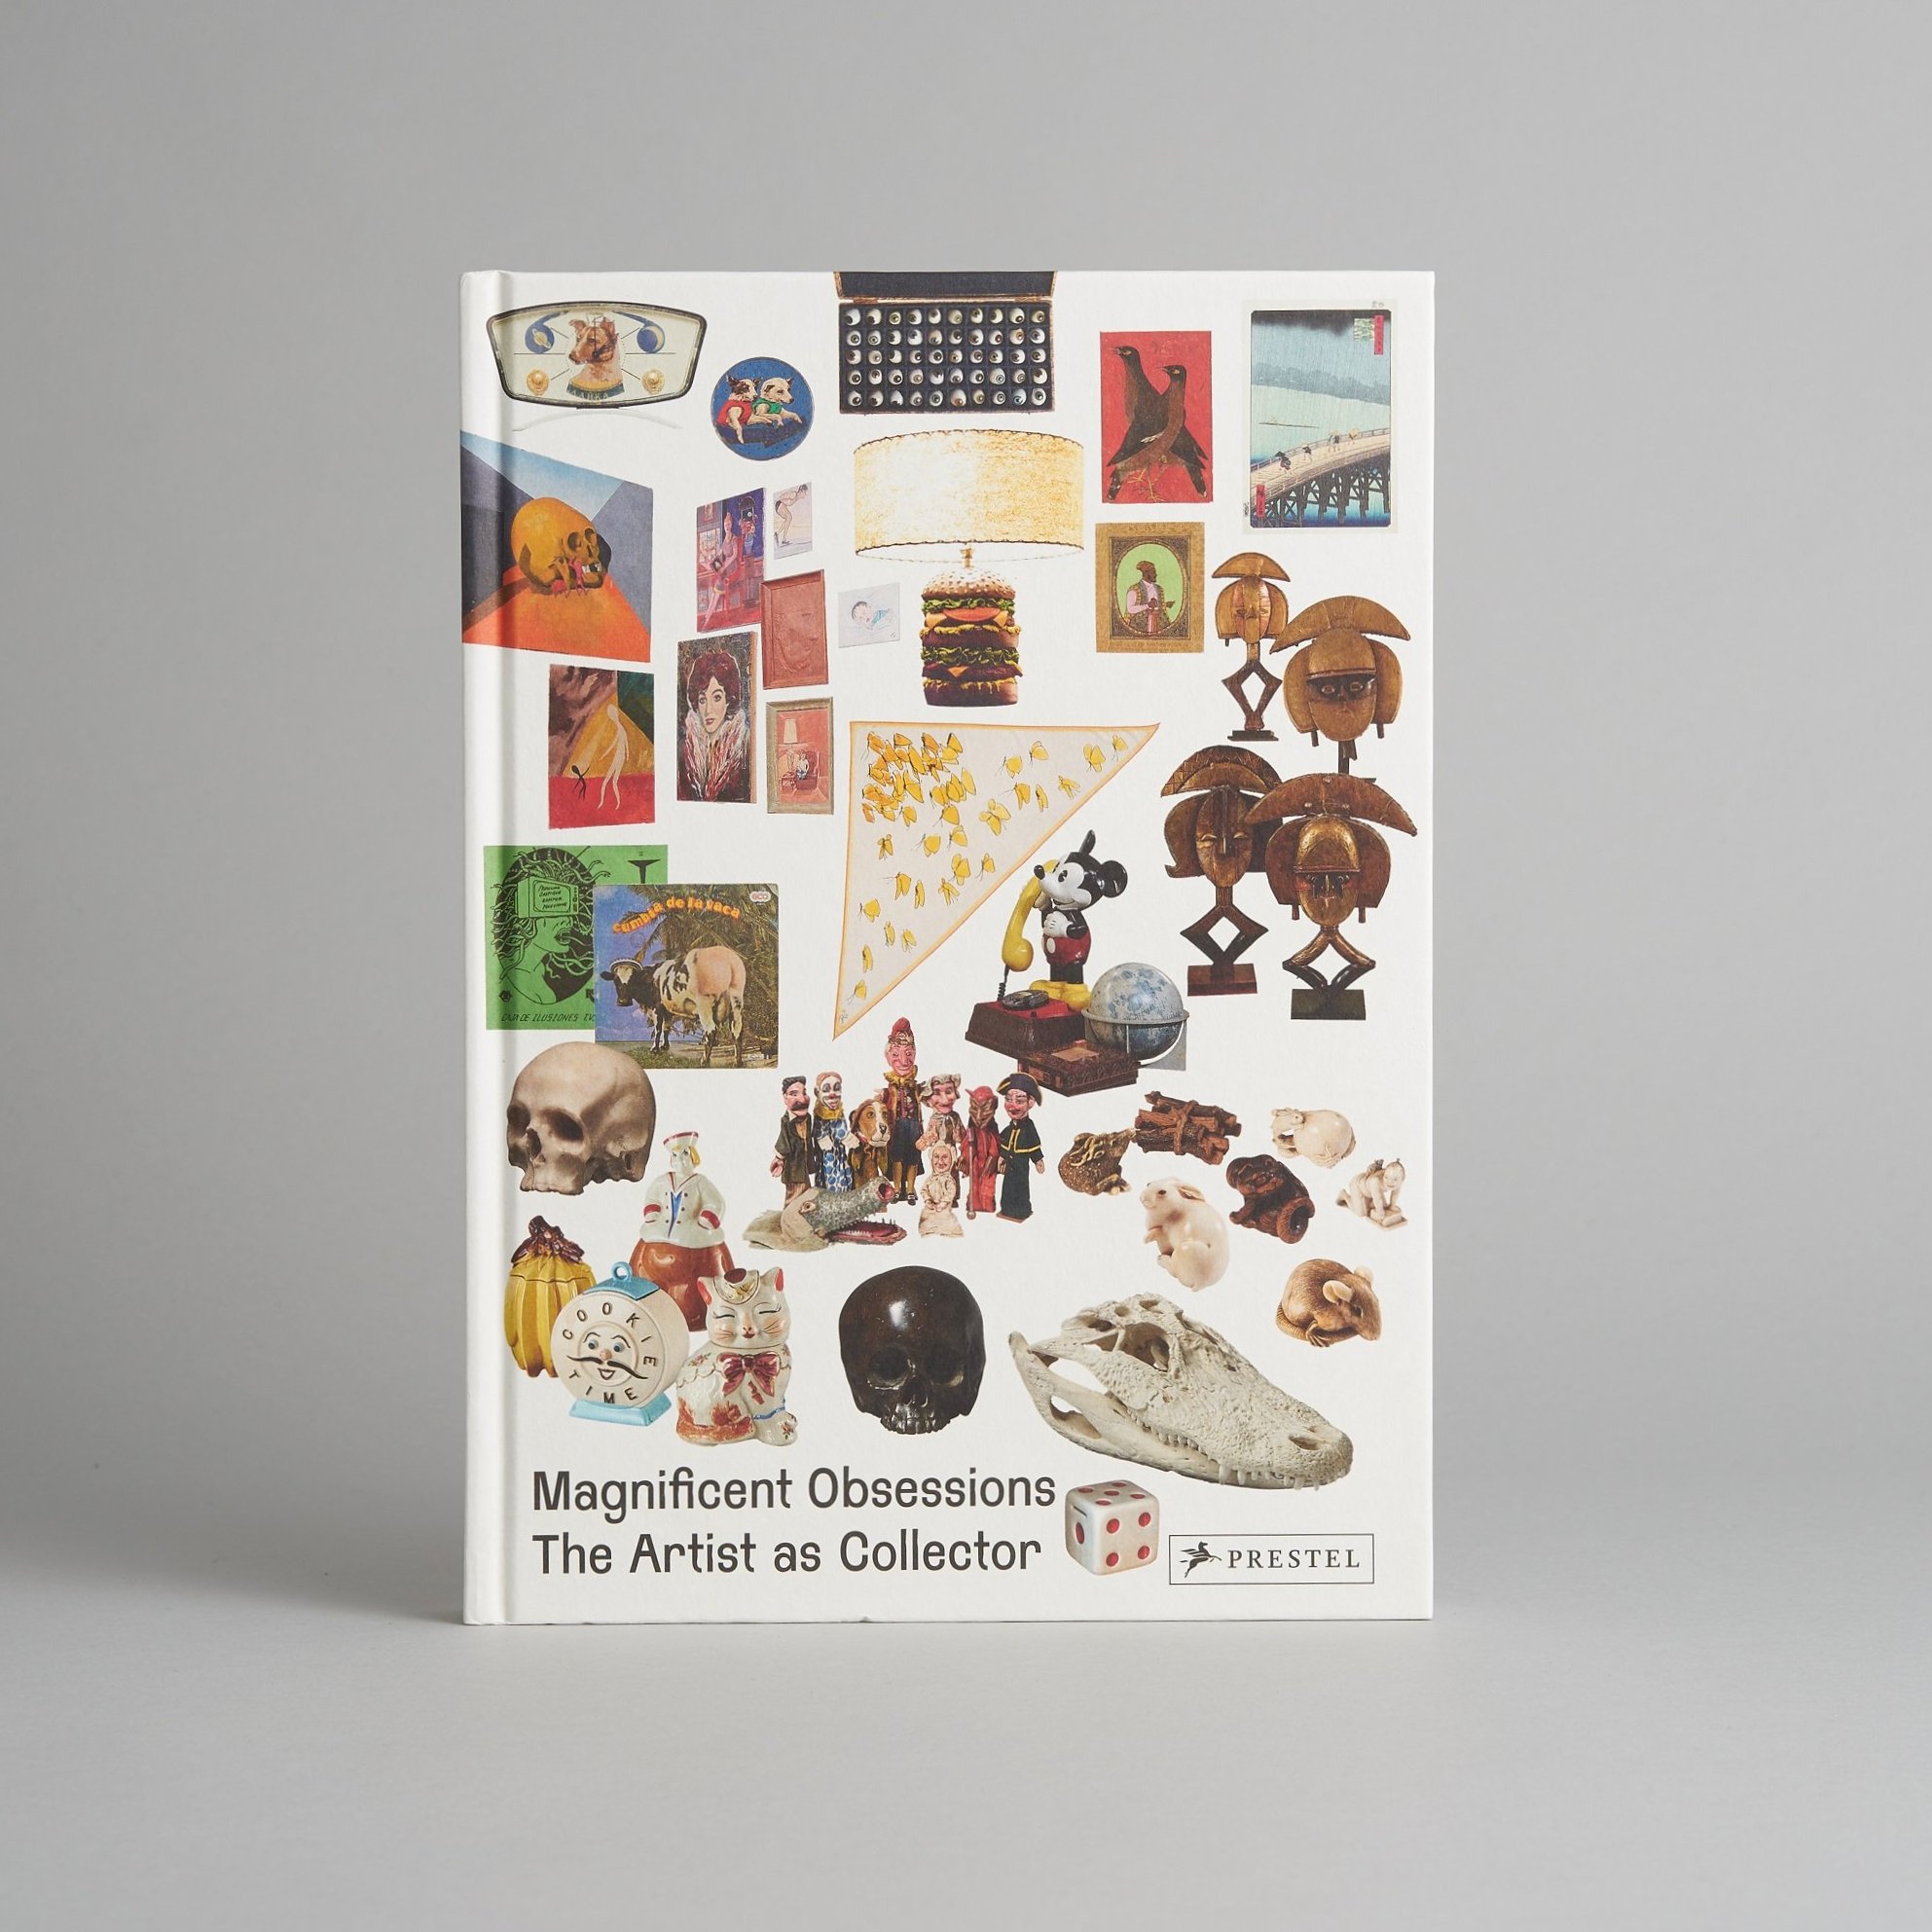
“While some artists are connoisseurs, others accumulate hords of objects, never letting anything go. Many live with an make direct use of their collections and others keep them under wraps or in storage. Collecting objects for research and study is key to the practice of many artists in the exhibition. Presented alongside expamples of their work, their collections, in turn, help to elucidatetheir art.” (Magnificant Obsessions Catalogue, the Barbican

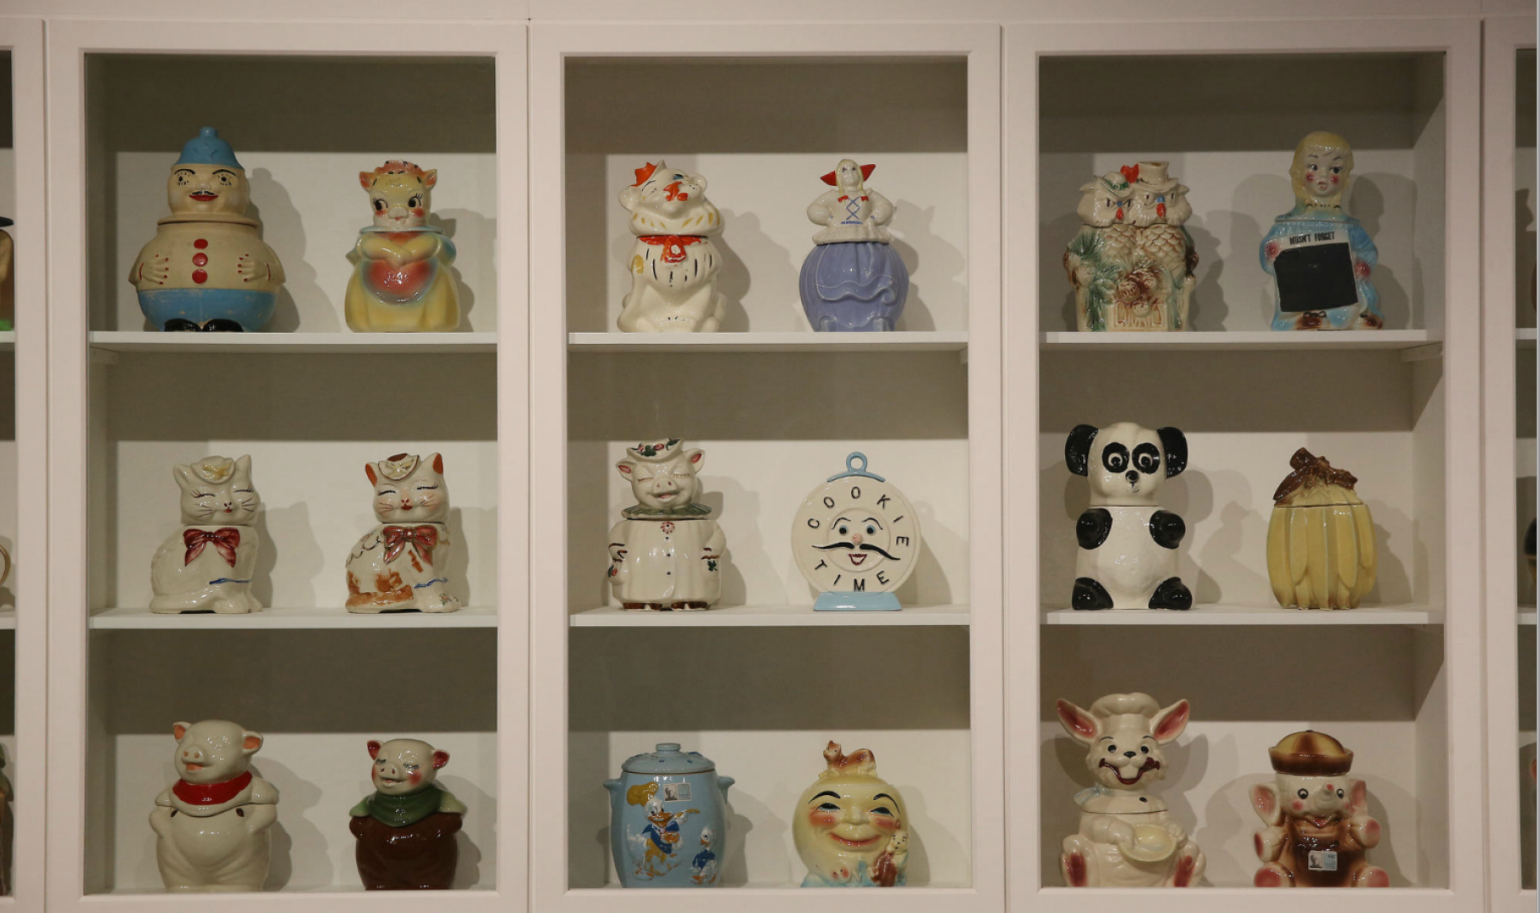
The Barbican exhibition shows that collecting and curating objects is something that many artists do. What Rautio’s work shows us is that this is likely to be a human practice that starts in early childhood, and that the reason for this is as much a result of the materials as it is the person.
In his book “Making: Anthropology, Archaeology, Art and Architecture” Tim Ingold makes the distinction between objects and materials and their connection to humans. We explored this by taking object’s from our studio desks and sharing them with someone else to see if traces of their contact with humans could be found and if so whether these traces told narratives of the connection.
This was harder to do with raw materials but as Ingold writes the connection is still there:
“What is odd is that studies of the material culture of kitches have generally concentrated on pots and pans, and spoons, to the virtual exclusionof the soup. The focus, in short, has been on objects rather than materials...Next time you are making soup, pay attention to hte way your stirring gesture with the spoon both induces and responds to viscosities and currents of the mixed ingredients.”
We then went on to examine the materials used in IED 2017 graduates work to show how materials convey information. Sometimes this is through a more obvious connection such as using ice to show climate change data. At other times this is through the process of displaying the information through a mode less commonly associated with the data, such as by casting data shown in bell graphs into actual bronze bells. Thereby allowing the data to be heard not only seen.
“I thought to myself, might we not learn more about the material composition of the inhabited world by engaging quite directly with the stuff we want to understand: by sawing logs, building a wall, knapping a stone or rowing a boat? Cound not such engagement- working practically with materials- offer a more powerful procedure of discovery than an approach bent on the abstract analysis of things already made?” (Ingold, 2007, p.3)
What are the materials of your work? How well do you understand them? How can they be transformed? What are the affordances of the materials you work with? One IED student did this by seeing what would happen when she fried paint.
“Humans are defined to an extraordinary degree by their expressions of immaterial ideals though material forms.” (Miller, 2005)

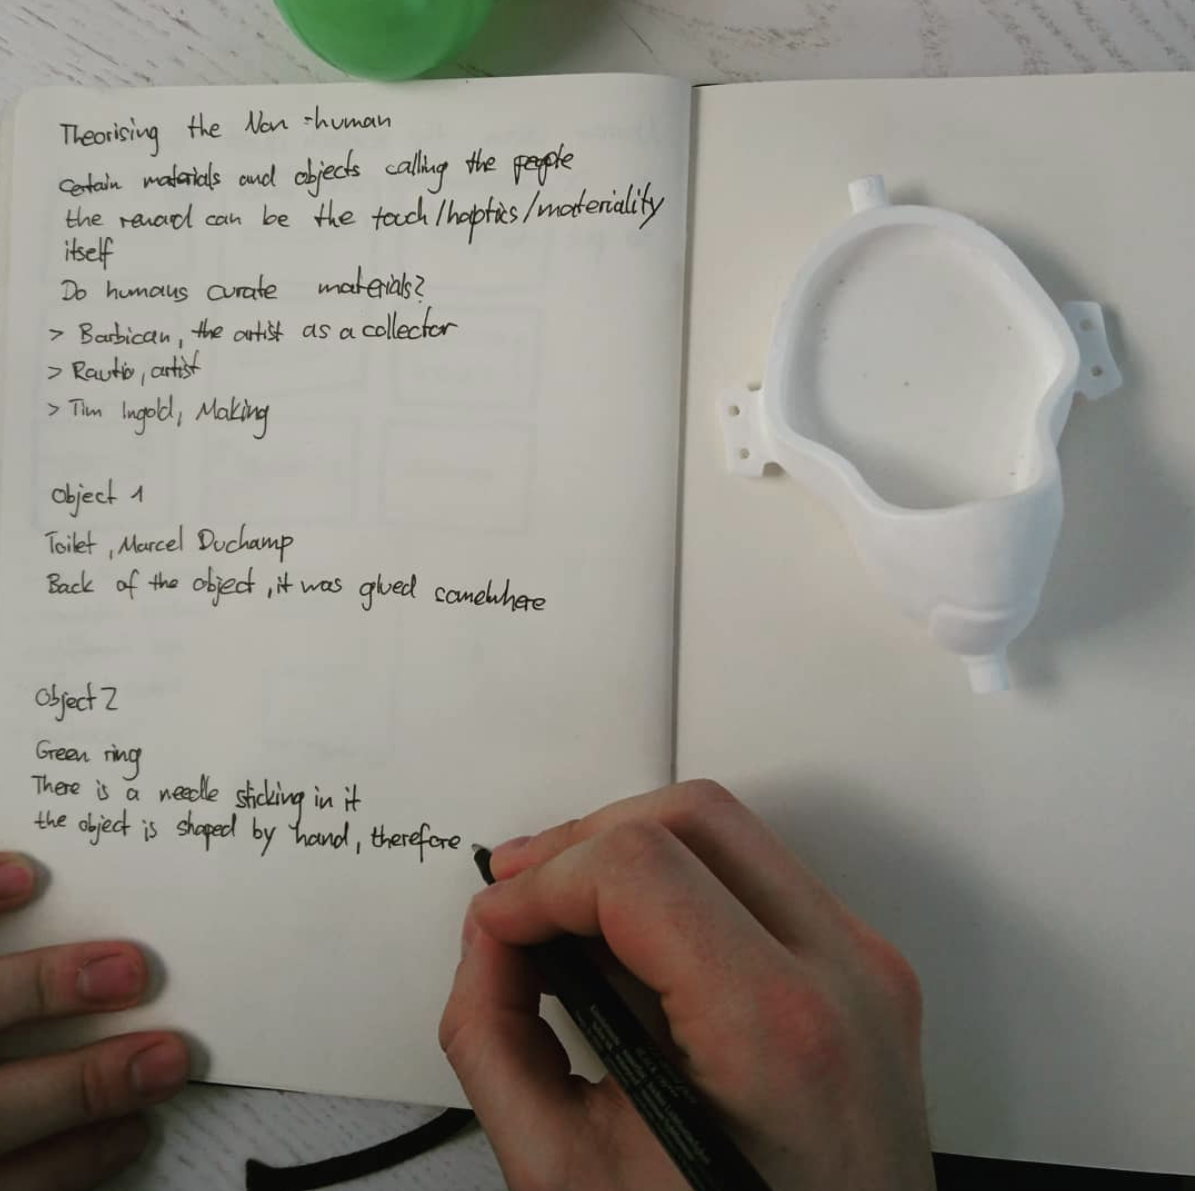
Practical: Using the three stages of Object Ethnography as outlined in Carrington’s (2012) work students were asked to analyse an everyday object in the following ways.
- The analysis of what can be ‘read’ in relation to the intentions and expectations of the designers of the object.
- Focus on the social life of the object “Appadurai’s (1986) points out that objects have a social biography. Artefacts have an agency or intentionality, but also that they have an individual history that is significant for the people that make use of them”.
- View objects as players in the building and maintenance of social and cultural myth. Carrington (2012) talks about this in relation to the image of the iphone to represent the user in a certain way. Explore how your everyday object is used by other people in the local environment. What does its use say about culture in relation to it? Could you alter the object to give off different signifiers?
Ontology & Epistemology
-
Should I use big data?
-
Should I use small data?
-
What is the difference between quantitative and qualitative research?
This workshop started with a brief introduction to the concepts of epistemology and ontology, which are critical to thinking about research as they relate to our beliefs on what is knowledge and how it can be collected. There was a chance to explore our own ideas of what is real or not and how this relates to our postionalities as a researcher, designer, maker and artist. Using Hayao Miyazaki’s Spirited Away as a starting point we explored how the narratives in our IED work might be radically different if we were to take a completely different philosophical stance to it.
I described the different sections to research and how our understanding of ontology and epistemology will inevitably shape the theories and methods of research we adopt.
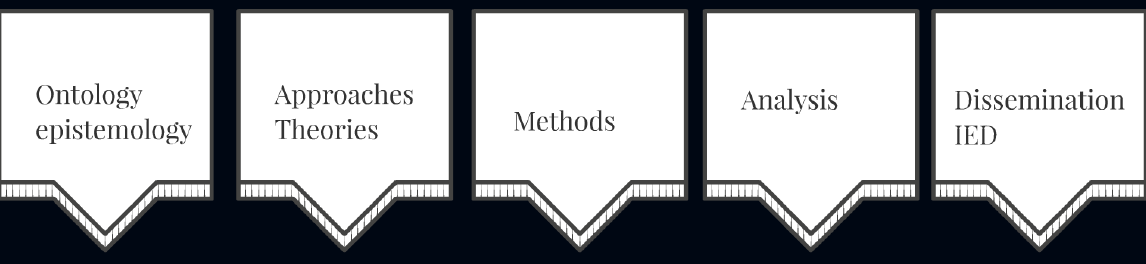
Ontology is the philosophical study of the nature of being, becoming, existence or reality as well as the basic categories of being and their relationships. Watch here. Epistemology studies the nature of knowledge, justification and the rationality of belief. Watch here. These ideas give rise to how research is undertaken + what is considered valid or rigorous and thus in part brings about decisions about whether to undertake quantitative or qualitative research etc. This in turn is what brings about big data or “very small data”.
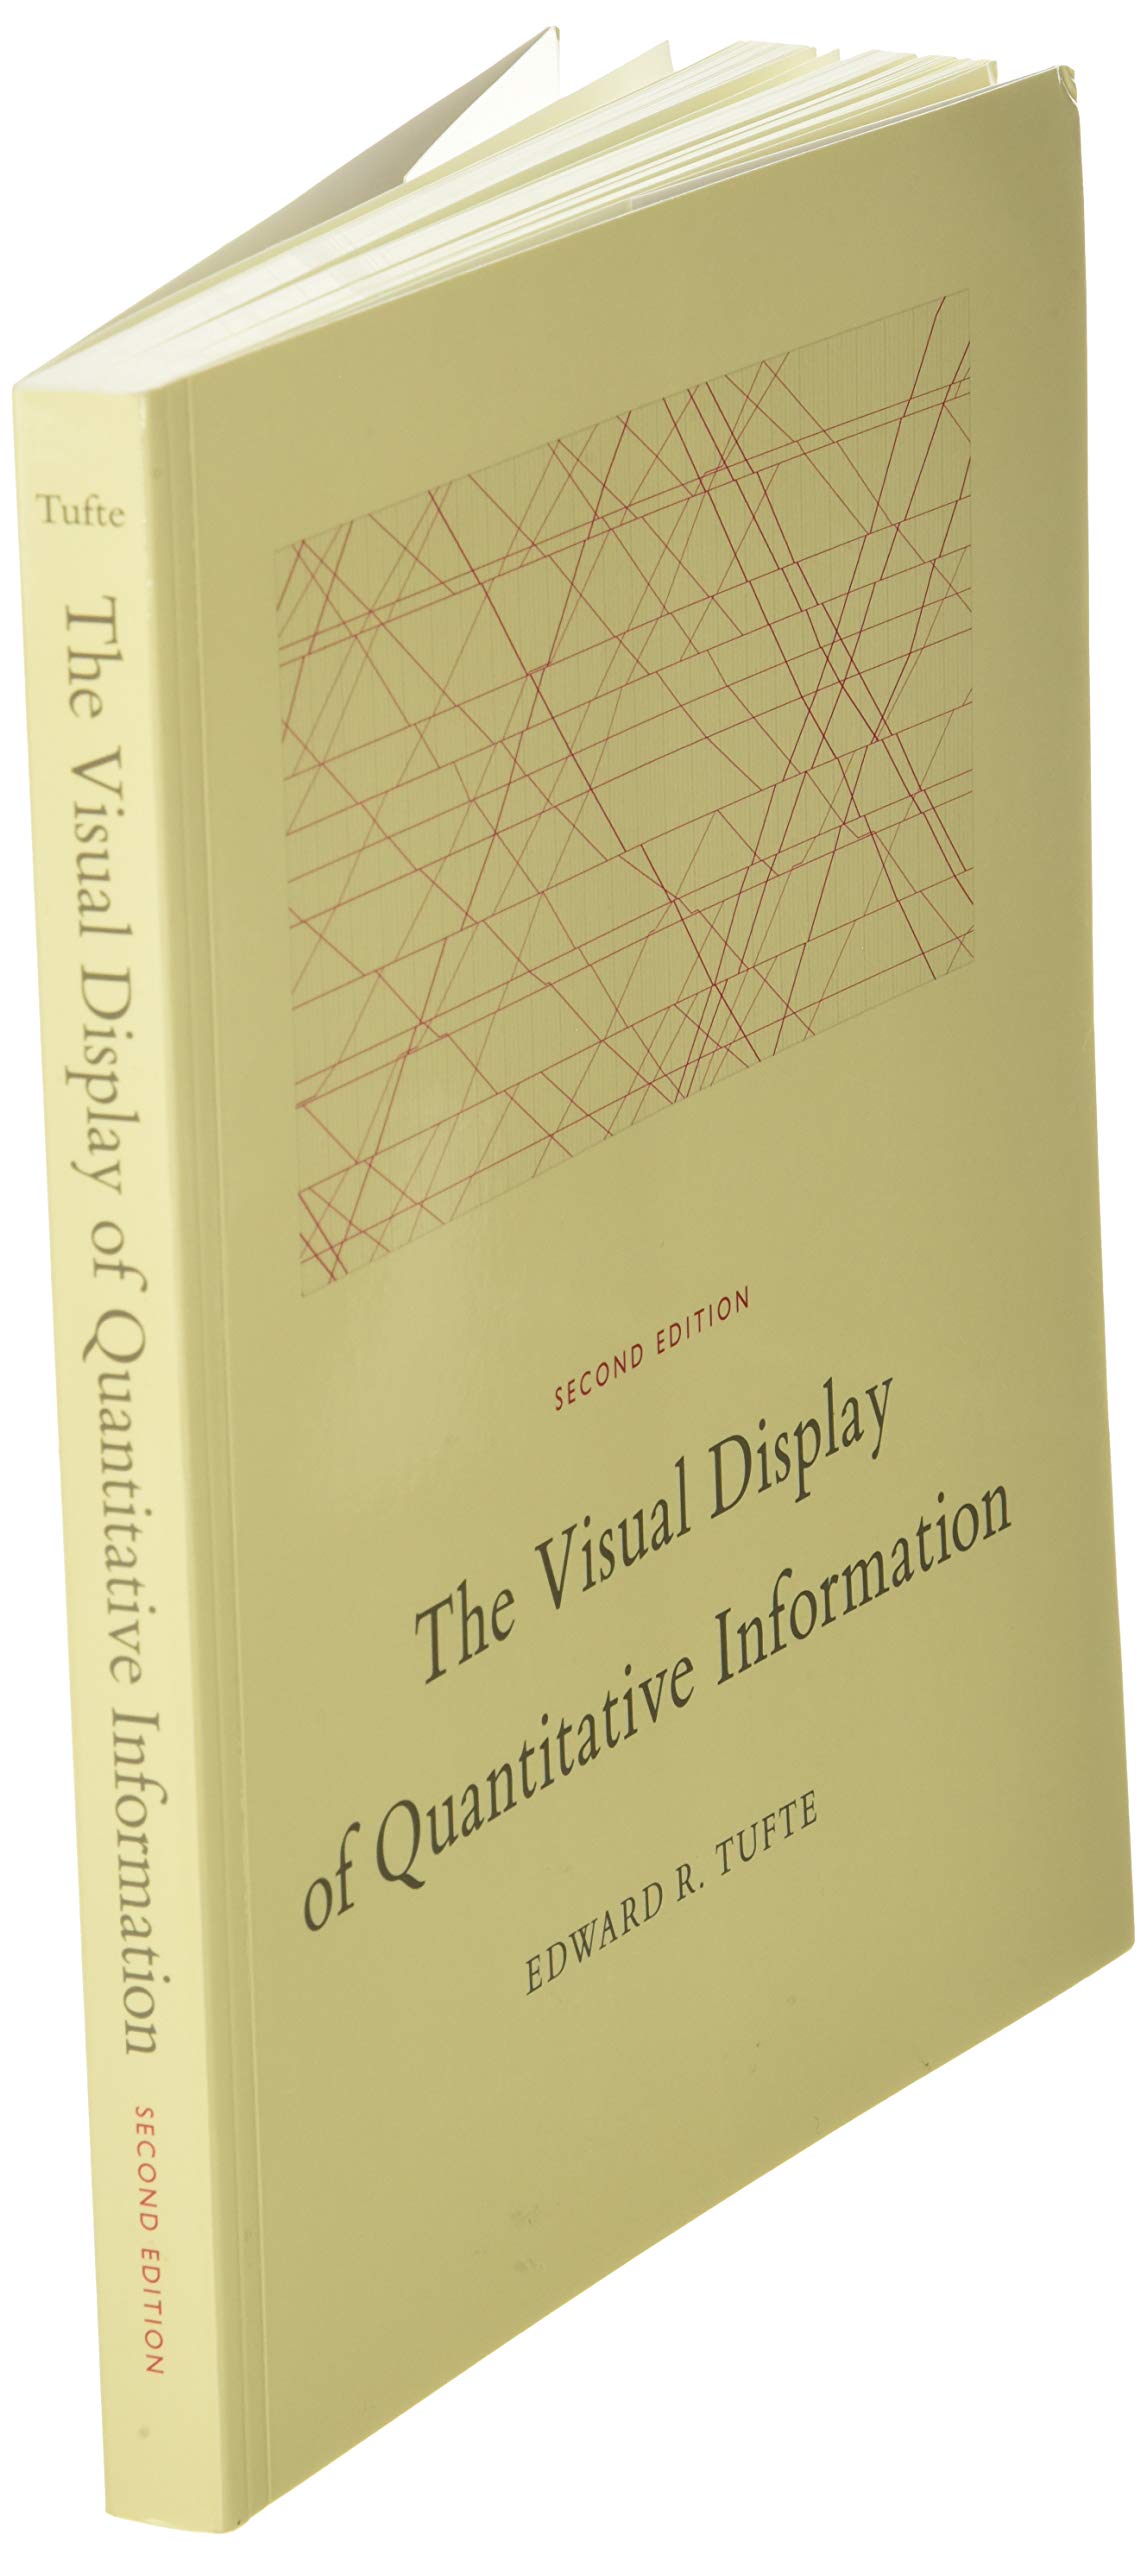
Tufte shows us how Big Data visualisations are not new. The following are two examples of this that are worth looking up:


At the opposite end of the scale is auto-ethnographic such as my comics about my experience of PTSD:

Greenbank (2003) says ‘moral values do not operate in a vacum’ (p.795). In relation to this we discussed the extent to which we thought it was possible or not to be an objective researcher. In relation to this I discussed how I previous research question I had sought to answer related to me:
Practical: the group were asked to explore the concept of ontology through a material they were currently using in their IED work by using making to explore one of the following:
- The relationship between the material and other objects
- The materials relationship to history
- The materials relationship to you
Further Reading
Sousanis, N. (2015) Unflattening. Cambridge, MA: Harvard Univ. Press.